Pendal Group starts trading on the ASX and new brand unveiled
Pendal Group Limited, formerly BT Investment Management, today unveiled its new brand and was welcomed to the Australian Securities Exchange (ASX) with its updated ticker, PDL. Pendal’s Chairman, James Evans, and Group CEO, Emilio Gonzalez, rang the bell to commence trading for the day.
Read more about the unveiling here.
Surprisingly, many investors are overlooking the mid cap segment of the Australian share market, which has delivered higher returns than the broader market over the past decade. In this video, Equities Portfolio Specialist Chris Adams looks at why mid cap stocks are attractive investments and explains how our experts add the best stock ideas to an investment portfolio.
Find out more about the Pendal MidCap Fund here.


“Mexico leftist Amlo vows no nationalisation, no expropriations”
Financial Times headline, 9 March 2018
One of the challenges in analysing the effect of political change on capital markets within emerging markets is the short history of the asset class. With 30 years of data at most, a country with a four-year electoral cycle will only have seven or eight electoral data points to consider and these must also be taken in the context of economic and market drivers at both the national and global levels.
And this matters in 2018 with a fully-loaded electoral calendar (notwithstanding the unscheduled transitions in power we have seen this year in Peru and South Africa). In particular, the two large Latin American markets, Brazil and Mexico, go to the polls in October and July, respectively, while Colombia also votes on its next president this month.
Brazil’s political disconnect
Since emerging market equity came to the fore as an asset class in the late 1990s, Brazil has seen seven presidential elections. The return from Brazilian equities in those calendar years (as measured by the MSCI Brazil Index in US dollar terms) has varied widely, from +63.8% in 1994 to -44.1% in 1998. Overall, the average US dollar return in an election year in Brazil is +8.7%, compared with an average of +9.4% in those same years for the MSCI Emerging Markets Index, suggesting a limited impact.
Where the Brazilian electoral experience gets more interesting is if we separate out the elections that returned generally centrist/conservative presidencies (1989, 1994 and 1998) from those that returned more left-wing/populist governments (2002, 2006, 2010 and 2014). The first set saw an average market return of +17.9% compared with +7.7% for the MSCI Emerging Markets Index in those same years, while the second set saw an average return of +1.8% compared with +10.7% for the same index. It seems the focus needs to be on the election result rather than the simple fact of an election. This is further supported by the sharply negative short-term market performance around the 2002 and 2014 elections, which were finely balanced but ultimately decided in favour of the left-wing candidate.
And south of the border….
A potentially similar pattern is also seen in the Mexican presidential elections (although these are held every six years, so there are even fewer data points). Mexico has elected presidents in 1988, 1994, 2000, 2006 and 2012. Despite a wide range of results (including the disastrous year of 1994 which saw a leading candidate assassinated in March and a sovereign debt default in December), the overall pattern is that the average market return in these years has been +15.2%, compared with +9.1% for the MSCI Emerging Markets Index. Significantly, in none of those five elections has the most left-wing candidate been victorious, suggesting a similar market dynamic to that seen in Brazil.
So what is the prognosis for 2018? The Mexican election is likely to be won by a populist left-wing candidate, Andrés Manuel López Obrador (normally known as Amlo). This implies significant risk to Mexican equities heading into the election, and despite other attractive features of the market, we retain our neutral position because of political risk. Although, we would note that as per the quote above, Amlo has sounded far more centrist in recent weeks, and significant weakness in Mexican assets around the election may offer an exciting buying opportunity, as was seen in Brazil in 2002 when Lula was first elected.
The Brazilian election is complicated. With Lula (the left-wing Partido dos Trabalhadores (PT) party’s preferred candidate) potentially facing jail for corruption, the leading candidate is abrasive far-right politician, Jair Bolsanaro. If he is to be Brazil’s next president, the better comparison may be the present-day Philippines under President Rodrigo Duterte. Since President Duterte assumed office in June 2016, the MSCI Philippines Index has returned -10.6% (in US dollar terms), compared with a return of +46.5% from the MSCI Emerging Markets Index. We consequently remain underweight Brazilian equities.

The BT Wholesale Enhanced Cash Fund shifted to a neutral stance on investment grade (IG) credit at the start of February after being positive on the segment for a number of years. A number of the positive tailwinds that have supported IG credit are becoming less clear, with monetary stimulus being removed globally and signs of inflation and wage growth, at least in the US. We believe this concern over where inflation is moving to will continue to see bouts of volatility in bond and equity markets in the near term.
Concerns around levered corporates in the high yield space having to pay higher interest rates in the future are at the core of this change in strategy. Higher borrowing costs will pressure corporate profitability and credit metrics. In turn, this should drive credit spreads – which represent the additional cost of borrowing over the relevant government bond yield – to a wider margin, which has a negative impact on the value of these securities. We believe IG credit will outperform the high yield market, although credit spreads will be pushed wider in both IG credit and high yield markets. The risk-reward trade-off that often favours being overweight investment grade credit is no longer there in the near-term. Trade war developments add to our concerns here.
Our quantitative credit model scorecards, which use economic and market data factors to provide indications for future market directions, have also recently shifted from a bullish to a more neutral bias for investment grade credit. This has been echoed in our technical analysis scorecard signals, which have also turned bearish.
Our fundamental signals have shifted….
BTIM Credit Model Scorecard – Australian and European Investment Grade Credit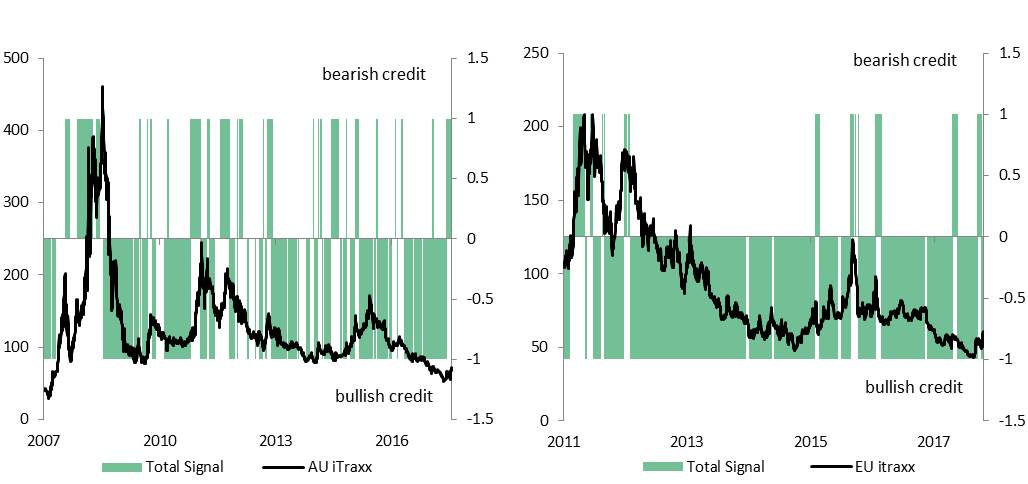
Source: BTIM
However, given the extended period of low inflation in the US, it is difficult to determine when and to what extent inflation will rise and the impact on bond yields and corporate interest expenses and their ability to refinance. Given this uncertainty, we prefer to hold a neutral stance towards investment grade credit while we wait for more economic data to establish direction.
Volatile times call for caution
Increasing share market volatility remains a significant negative for credit markets, given their linkage to broader risk sentiment. However, the corporate fundamentals which we regularly monitor remain healthy, as illustrated in the charts below.
Corporate fundamentals remain healthy… …while debt levels remain low…
Corporate earnings per share expectations – one year forward (select markets) Corporate balance sheet leverage – select markets
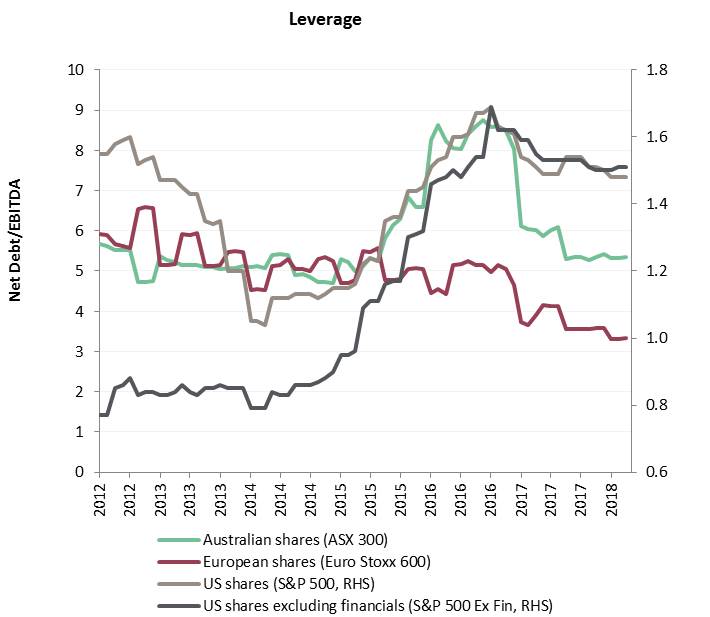
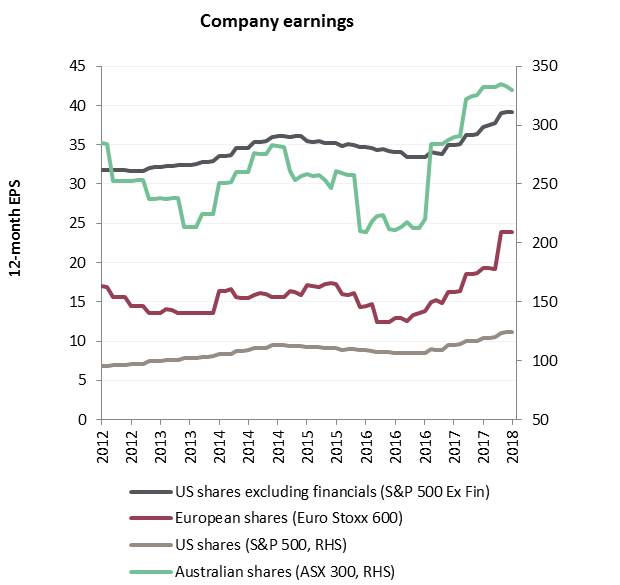
Source: Bloomberg
In summary, corporate balance sheets are strong and earnings growth is solid within the major developed markets. This balances the perceived macro risks to IG credit and in the present environment, warrants a neutral stance.
This article appears in the BTIM Australian Quarterly Update (April 2018) which provides a broad collection of views from BTIM’s investment professionals on the local economy, bond yields, credit markets and the importance of sustainability analysis.
On Friday 27 April 2018, BT Investment Management’s shareholders voted to approve a change of company name to Pendal Group Limited.
We are currently working to legally change the name of the company with the Australian Securities and Investments Commission. To reflect our new name, we will also change the names of our funds and the names of the responsible entity and investment manager of these funds. We expect these name changes to be effective by Friday 4 May 2018.
Whilst our name is changing, it remains business as usual with no changes to our relationships or contractual arrangements. Importantly, our investment teams also remain the same, with no changes to their structure or investment approaches.
We will be updating our website with more information In the next week, as we transition to our new name and brand.
Read the ASX announcement here.

What has happened?
In 2014, as the military conflict in Ukraine escalated, the EU and the US (and various other nations) imposed a series of economic sanctions on Russian individuals and entities. From an equity investor’s point of view, the key components of the sanctions were a ban on buying and issuance of new equity for four large listed Russian companies: energy firms Rosneft and Novatek and banks Sberbank and VTB Bank. The securities of all four remained tradeable, as long as they did not issue new equity, which they have not done. There was also a ban on the provision of technology, equipment or assistance by Western firms to Russian offshore, deepwater or shale energy projects.
With further concern about the actions of the Russian government and/or entities connected to Russia’s Government, on 6 April 2018 the US Treasury department announced a new suite of measures, which has had a significant effect in Russian capital markets.
A series of Russian private citizens and government officials (including, importantly, Oleg Deripaska), and firms connected to those individuals, have been designated for sanctions. Crucially, these specifically bar the trading in securities of designated companies as well as limiting those companies’ access to the US dollar payments system. The listed companies designated were mostly unlisted, but did include Rusal (primary listing in Hong Kong) and EN+ (listed in Moscow, London and Paris in depository receipt form).
This had two immediate effects: the two main clearing houses for security transactions moved to immediately limit trades in the securities of Rusal and EN+ (Clearstream has said it will not process trades at all, and Euroclear will only process sales). Additionally, Rusal warned of potential credit defaults and asked its customers to suspend payments while it finds a way to be paid without breaching sanctions.
Market impact
The initial impact of this latest round of sanctions was severe. Perhaps with the US$8.9 billion fine levied on BNP Paribas for breaching sanctions on Iran in mind, there was a broad sell-off in Russian assets, and a very severe sell-off in the shares of the most affected companies, Rusal and EN+.
Rusal and EN+ fell over 50% in US dollar terms, with broad declines in other large cap stocks. The large energy names fell around 10%, Norilsk Nickel fell 18.7% and Sberbank fell 21.6%. Overall, the MSCI Russia US$ Index fell 12.4%, driven partly by a 4.2% fall in the Russian rouble to 62 to the dollar, while Russian sovereign CDS (5-year US$) moved from 120 to 140 (and subsequently widened further). Clearly, these are very substantial moves, and far greater than seen with previous rounds of sanctions.
Top-down implications
Whilst the stock-specific implications could be disastrous for the designated companies, the overall economic effect is likely to be more limited. As an exporter of US$-priced commodities, Russia is vulnerable to disruptions to its use of the US dollar payments system, but elsewhere Russia has considerable strengths. Crucially, Russian exports are commodities and essentially fungible. Barring world-wide sanctions, Russia can supply energy and bulk commodities to other parts of the world (crucially China) and be paid in an alternative currency (probably Chinese renminbi). Furthermore, Western and Central Europe depend on Russia for natural gas, with Gazprom representing a 40% share of supply in 2017.
Additionally, Russia runs a current account surplus (forecast at 3.0% of GDP in 2018) and a very limited fiscal deficit (forecast at 0.3% of GDP in 2018), thereby reducing vulnerability to reduced exports or financing.
The last year has also seen a steady rise in the oil price, which is ultimately the key driver of the Russian economy. With Brent crude currently trading at over US$70 per barrel, the Russian economy will continue to strengthen. A comparison of the oil price with the rouble, or with Russian sovereign CDS, shows the anomaly of the last week’s market moves.
That anomaly represents increased political risk, especially both the wider and more severe nature of the latest sanctions, the risk of Russian retaliation, and the consequent potential for even harsher sanctions. Markets are discounting the world’s cheapest equity market even further in a classic fear-driven, risk off move.
For comparison, the 2015 peak in CDS was 628 and the 2016 low in the rouble was 82.45 to the US dollar. Underpinned by a strong oil price, it is hard to see current risks in Russian equities as comparable with those that existed when the oil price traded below US$45 per barrel.
Portfolio changes
At the start of the month, our portfolio held four Russian stocks: larger positions in Sberbank and miner Norilsk Nickel, and smaller positions in retailers Lenta and Magnit. We have sold our entire position in Norilsk Nickel. The company has a superb operating asset, with large by-product credits giving an effective negative cash cost of production for nickel, while nickel prices remain over US$13,000 per tonne. The stock has fallen to 8x consensus 12-month forward earnings, and could potentially have a 10% dividend yield in the next year. However, Norilsk’s largest shareholder is Rusal, with a 27.8% stake. Rusal has been sanctioned along with its parent EN+ and Oleg Deripaska, EN+’s controlling shareholder. Norilsk Nickel has not been designated as the US Treasury applies a 50% control rule and Rusal owns less than 50% of Norilsk. However, there is a very clear risk that a further round of sanctions could result in Norilsk being designated. This risk is further increased as Oleg Deripaska has recently been nominated to Norilsk’s Board of directors. We consider this stock-specific risk to be unsuitable for our strategy, especially given the attractive valuations available elsewhere in the Russian equity market.
We have increased our position in Sberbank to around 3.0% of the portfolio. Sberbank is a parastatal, with a control stake owned by the Central Bank of Russia; Sberbank’s bonds trade approximately in-line with the sovereign. Sberbank has had strong operational performance in 2017, with a 38% year-on-year increase in net earnings, balance sheet growth with good cost control and some impressive developments in using technology to service both retail and corporate customers. 2017 return on equity was 23.8%, the balance sheet is strong with a Tier 1 capital ratio of 11.4% and a trailing non-performing loan ratio of 1.8% (and a loan loss reserve multiples of the non-performing loans). As such, the decline to a trailing price/book ratio of 1.3x and a 12-month forward price/earnings ratio of 5.2x seems excessive given where the oil price and Russian CDS are (and given the parastatal status of Sberbank). Sberbank is one of our highest conviction stock ideas and we have invested accordingly.
In the mid-cap space, we have maintained our positions in the retailers, and also added a position in a high quality industrial name, GlobalTrans. GlobalTrans is the leading rail freight transport company in Russia, specialising in bulk transport of commodities. GlobalTrans’ controlling shareholder, Konstantin Nikolaev, has not been designated for sanctions. Recent results have been very strong, as the company’s investments in both its fleet and its logistics capabilities have come through – the industry is one with very strong network effects, as minimising the proportion of empty runs is the key operational edge. H2 2017 earnings (EBITDA) growth was 35% year-on-year, with a 51.4% EBITDA margin and a 20% return on invested capital.
One of the reasons we are very positive on GlobalTrans is the management’s excellent capital discipline. Having invested in the fleet, strong free cash flow is being returned to shareholders, with special dividends bringing the trailing dividend yield to 6.5%, and there is a commitment to maintain the dividend policy unless attractive acquisitions become available. The company’s recent investments in its own locomotive fleet for rail tank traffic has been paying off, and we find the combination of a highly profitable business with excellent capital management, good growth prospects and a 12-month forward price/earnings ratio of less than 10x very attractive.
Political risks have undoubtedly increased in Russia in recent weeks, but a strong oil price is a very substantial offset, as is the strong current account and fiscal position. Where valuations are attractive, we will look for opportunities. We always prioritise stock-specific ownership and corporate governance matters in our bottom-up research process, as demonstrated by our sale of Norilsk Nickel and investments in Sberbank and GlobalTrans.
Fund Manager commentary for the month and quarter ended 31 March 2018 covering market reviews, BT Investment Management fund performance and our outlook for the period ahead.
Access the monthly commentary here.
Access the quarterly commentary here.
As active investors, we hold the fundamental belief that markets are inefficient and that, through the application of a well-considered and well-tested investment process it is possible to outperform over the longer term. As top-down investors, we believe that a lot of that inefficiency can be found at the country level, through excessive optimism or pessimism about growth prospects, sustainability of growth, currency outlook or the political and governance environment in that country. As growth-at-reasonable-price investors, we pragmatically believe that markets will, at times, misprice part of the growth-value spectrum in the asset class.
Current concerns: the aggressive and excessive re-rating of growth
We believe that anomalies currently exist within the emerging markets equity asset class in the pricing of growth and fundamentals in both top-down and sector/stock-specific dimensions. Following are some examples…
Chinese internet stocks
Chinese internet stocks soared in 2017. One of the biggest winners was Tencent, a colossus of the Chinese technology landscape, in large part because of its ubiquitous WeChat messaging app which has one billion users. At the time of writing, Tencent is valued on a dizzying multiple of 37 times its 12-month forward price/earnings ratio (P/E). This represents over one standard deviation above the historic mean 12-month forward P/E ratio for the stock, which is statistically material. Previous occasions when the stock has been valued at this elevated level have been followed by de-ratings back to its average price. Should Tencent finish 2018 at its long-term average valuation (29.7 times 12-month forward P/E), the stock would finish the year below its current level, assuming it achieves consensus 2019 earnings. And this assumes that Tencent continues to grow its revenues by greater than 50% for the foreseeable future in an economy growing at an estimated 11% in nominal terms.
Tencent’s toppy valuation
Source: Bloomberg
Other Chinese internet names have lower but still demanding valuations, arguably weaker business models and more challenging governance aspects. Of particular note is the re-rating of Alibaba, which has just enjoyed three very strong quarters in terms of growth in revenue per active user within China and from international revenue, but which seems to have been factored into the share price (the share price has more than doubled since the start of 2017).
An additional component of our growing caution on Alibaba is the firm’s use of cash flow. Since the end of 2015, the company has generated RMB 196 billion in cash flow from operations. This might not seem much over eight quarters for a company with a market cap of RMB 3 trillion (US$482 billion), but of that cash flow, RMB 117 billion was used to fund acquisitions in everything from e-commerce in other emerging markets to luxury malls, newspapers and supermarkets. It remains to be seen whether all of those assets will attract the 29 times 12-month forward P/E multiple that Alibaba currently trades on over the longer term.
Beyond Tencent and Alibaba, other Chinese internet names have experienced similar performance, reacting to strong operational growth with very large share price rises over the past year. The space has enjoyed growth, price momentum and significant investor interest, but it remains our view that share prices cannot outstrip earnings indefinitely.
Lofty valuations in some segments
It is not just in the Chinese internet sector where valuations have exploded far beyond levels supported by underlying earnings fundamentals. There are a number of companies within emerging markets that are challenging even the most generous of assumptions to arrive at the market’s lofty valuations. A few notable examples include Mercado Libre, the operator of an online trading site in Latin America; Celltrion, the largest of a group of related Korean biotechnology companies; and HDFC Life, the life insurance subsidiary of a leading Indian financial services firm, HDFC. By way of example, HDFC is trading on a price/book value of 25 times (no, the decimal point is not missing!) Compare this valuation to industry-leading regional insurer, AIA, which trades at a price/book value of 2.4 times and China Life Insurance trades which trades at 1.7 times and the degree of exacerbation becomes apparent.
To illustrate the degree of dispersion across emerging market companies we have created a composite value measure of index constituents to track their valuation over the past five years. The chart below highlights the degree of dislocation in valuations.
The most expensive emerging market stocks have become far more expensive
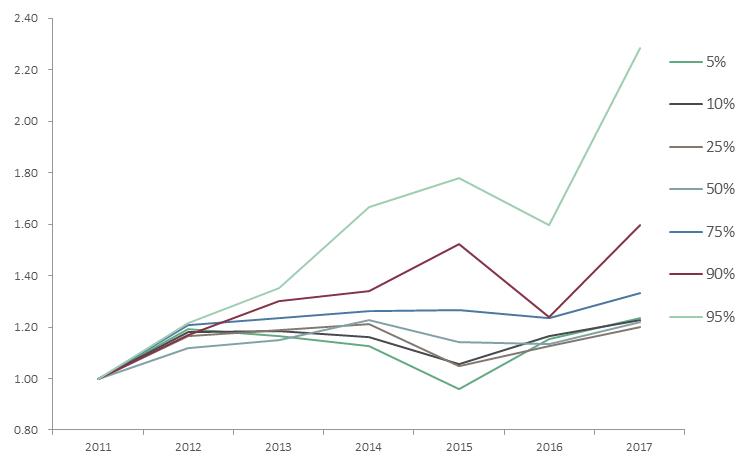
Source: JOHCM. Composite value measure of MSCI Emerging Markets Index constituents, based on price/book, price/earnings and inverse dividend yield, 2011 = 1.0. Data as at 23 January 2018.
Looking into the top and bottom quartiles (by composite valuation), we find some interesting trends. The top quartile is dominated by China (based on benchmark weight), with India and Indonesia over-represented. At a sector level, information technology, consumer staples and consumer discretionary make up over 70% of the top quartile. The bottom quartile sees South Korea, China and Russia over-represented at a country level while financials is the dominant sector.
There is no natural limit to the premium to which growth stocks can trade at over other stocks. Nonetheless, we certainly feel that parts of the asset class (Chinese internet, consumer growth stocks in parts of Asia) will experience valuation headwinds from these levels.
It is clear that these companies very much represent the growth end of the growth spectrum, and this aggressive rerating of growth stocks is borne out in the index-wide data. By constructing a composite valuation measure (using price/book ratio, price/earnings ratio and the inverse of dividend yield), we can look at the re-rating of the most expensive stocks. The chart above clearly shows that the top-quartile of stocks has re-rated away from the rest of the asset class.
A distorted index: no time for a passive approach
One further impact from the aggressive re-rating of growth over the last two years has been its effect on the valuation of the overall asset class, as calculated by market cap-weighted or free-float-weighted indices. As these larger growth stocks have performed and re-rated, they have driven the overall valuation of the MSCI Emerging Markets Index higher. Some of these growth stocks now dominate the benchmark. At the time of writing, Tencent represents 5.6% of the Index, Alibaba 3.8% and the Chinese internet sector in total represents 12.6%. Naspers (a portfolio holding) has significant exposure to Chinese internet stocks and is a further 2.2%. Collectively, this 15% weighting is slightly larger than the index weight represented by the whole of Latin America plus Turkey plus Poland.
This really matters when one considers passive investing in emerging markets equity. An investor putting US$100 to work in a passive, MSCI Emerging Markets Index-based fund is putting the first US$15 into Chinese internet exposure and only about US$11 in total into the long-term growth stories of India, Pakistan, Indonesia and Egypt. Seen from another perspective, this hypothetical investor is putting over US$27 into information technology exposure and just over half of that into energy and materials.
Naspers – market-leading internet exposure at a discount
The portfolio retains a large position in Naspers, a South African-listed consumer stock. Naspers is a media holding company, with the single largest asset being 33% of Tencent. It also owns 28.7% of Russian internet company, Mail.ru (also listed). Naspers also has substantial investments in pay TV, e-commerce, online classifieds and online marketplaces.
“Passive flows, factor investing and active momentum investing are causing an increasing deviation between valuation and fundamentals”
By subtracting the current market value of the Tencent and Mail.ru stakes from Naspers’ market cap, it is possible to calculate the net value of Naspers’ other assets (including net debt and central costs). This stub has historically had a small positive value, but in 2016 it began to fall as Tencent outperformed Naspers, finishing the year with a valuation US$13.4 billion less than its stakes in Tencent and Mail.ru. In 2017, the stub value fell substantially (touching -US$50 billion and finishing at -US$42.3 billion) despite some very positive operational and financial developments in the stub. We see this as a major mispricing and as a further indication that passive flows, factor investing and active momentum investing are causing an increasing deviation between valuation and fundamentals in parts of the emerging market equity space.
Active opportunities
None of this is to call for a crisis in emerging markets. Global economic conditions remain robust. For about the last two years, exports and manufacturing purchasing manager surveys (PMIs) across the world have been robust, while an absence of inflation has allowed central banks to tighten slowly while longer-dated bond yields remain benign. This environment of stronger global growth but supportive global monetary policy is an ideal one for emerging economies. We believe this will create exciting investment opportunities in the emerging markets equity asset class. We are particularly positive on opportunities within India, South Korea and Taiwan.
India – a coiled spring
India has been a serial economic underperformer despite its potential to be one of the world’s fastest-growing economies. It has struggled recently with below-trend growth, but the conditions are in place for growth to explode over the next two years. In the short term, a general election to be held by 2019 at the latest means we can expect plenty of fiscal stimulus by the Modi Government to ensure that India’s economy is firing on all cylinders going into the polls.
On a more long-term structural note, last year saw two major developments in India that only add to our optimism towards India’s economy and, by extension, Indian equities. The first was the announcement of a recapitalisation of the state-owned banks of approximately US$32 billion over the next two years. This was by far the most significant move of any recent Indian Government to tackle the under-capitalisation of the state-owned banks.
The second was the announcement of a US$105 billion five-year road building plan to improve transport infrastructure to allow the economy to benefit fully from the liberalising effects of the national goods and services tax (GST). These steps are indicative of a government keen to ensure that the positive effects of its reforms are felt before the election.
We believe India’s economy resembles a coiled spring waiting to be released. Moreover, it is a growth story that should materialise irrespective of developments in the China and US economies. While India’s equities are not cheap in an absolute sense, the premium they attract over the average for emerging markets is slightly below its normal level, and we feel that the very strong growth opportunity and the prospects for further reforms justify current valuations.
South Korea – a winner on corporate governance
We believe South Korea stocks are cheap for corporate governance, not geopolitical reasons. Korea’s companies are rich in cash, yet Korea has the lowest payout ratio of any major market in the world. This is explained by a lack of effective oversight that allows company managers to simply hold cash back from shareholders, however this practice is changing. The behaviour of corporate Korea and the related lack of dividends has become a growing issue in Korea’s politics, as an ageing population needs income from its investments. We feel that both Korea’s public’s response to a recent corruption scandal and the resulting election of a left-wing administration will put huge pressure on Korea’s companies to reform. This will be the catalyst to unlock much of the hidden value in Korea’s equity market.
Taiwan – a play on global growth and rising yields
Taiwan is currently our third large overweight country position in the portfolio. As a heavily export-oriented economy with a large tech sector, it is an obvious beneficiary of the synchronised recovery in global economic growth. But it’s not just the export growth story that attracts us here. Taiwanese financials such as Cathay Financial Holding stand to profit from rising interest rates and bond yields, especially insurance names with large, established policy accounts.
Active on country and intricate on company
The multitude of economic, political, industrial and social factors that interplay in developing countries present many risks and opportunities for astute investors. Furthermore, the companies operating either within or across these markets can present their own set of interesting dynamics. Remember that these companies aren’t immune to the rapid shifts emanating from competitive forces and technological evolution that are more commonly related to companies in developed markets. However, focusing on either the country or the company in isolation can lead to overlooking a sizeable intersection of these two realms. It is what makes investing in emerging companies truly interesting and truly rewarding for investors who can appreciate the convolutions and the intricacies in tandem.
Topsy Turvy: In utter confusion or disorder; with the top or head downwards.
It is stating the obvious that trade wars will likely hurt economic activity for all involved. From a Goldilocks-like situation for global economic growth, this tit-for-tat introduces an unexpected degree of uncertainty. With US markets already buffeted by concerns of potential regulation on technology stocks, central banks withdrawing liquidity and normalising monetary policy, this tariff war is a completely unwelcome development. My expectation that the synchronised global economic recovery which started in late 2016 would likely persist a while is looking increasingly tenuous.
With that moderation in view, I have made some changes to the portfolio. I’ve started to pare back on some of the cyclical holdings, raised some cash while starting positions in a few core holdings. In the past 12-15 months, a few stocks from our core screening universe had either de-rated or seen a strengthening of competitive positions.
One such name I’ve bought back in the portfolio is LG H&H (Household & Health Care), a Korean company that has three main businesses: beauty (cosmetics), household goods (health) and beverages. The latter two businesses are mature and the past three years margins have trended lower on account of raw material cost inflation. It is LG H&H’s cosmetics business that was and still remains the key growth driver. It represents over half the group’s total revenues. You might recollect in September 2016, relations between China and South Korea hit a very rough patch. The then South Korean president moved unilaterally to deploy a missile defence system (bought from the US) ostensibly to protect against a North Korean missile attack.
China’s reaction was swift and strong. The Chinese authorities targeted several South Korean businesses in China. One group, Lotte, had several of its department stores and supermarkets shut down on inspections from authorities. There were ‘suggestions’ to travel agents in China not to book group tours from China to South Korea. LG H&H’s business was affected, both in mainland China, where some customers boycotted its products, and in Korea, when Chinese tourists, who are the largest buyers of these products, stayed away. It was a challenging time for the company yet it managed to survive this unexpected slowdown. Ultimately, consumers desire for their cosmetic products remains strong and the company kept spending on brand promotion and advertising throughout that period.
Much water has flowed under the bridge since. The then president of South Korea was impeached and removed from office, and the new president has taken a more conciliatory tone towards China. In this recent trade war between the US and China, LG H&H’s cosmetics business might turn out to be the potential beneficiary. China’s relations with South Korea have improved since that missile episode and the Chinese will likely woo its neighbours in this economic tit-for-tat with the US. Tourist traffic from China has resumed and queues at Korean department stores in Seoul for buying cosmetic products have started to get longer.
Welcome to the inaugural BTIM Australian Quarterly Update.
While we offer our broader global macro insights in my monthly piece, we believe a more Australia-focused update will be valuable to our readers. This newsletter will draw from our strong expertise and range of capabilities in the domestic market. We therefore commit to providing views on the local economy, rates, credit and ESG developments from our portfolio managers.
I hope you find the piece useful and we welcome feedback from readers.
View our first Australian Quarterly Update here.