BTIM’s Davidson and Forrest on how Amazon is reshaping malls
From the Australian Financial Review; by Vesna Poljak; published 12 November 2017
Reproduced with permission from Fairfax Media

BTIM’s Pete Davidson and Julia Forrest. Photo: Daniel Munoz / Fairfax Syndication
When Myer declined to renew its lease at Westfield Hurstville, a Scentre Group shopping centre in NSW, a chill went through the property trust sector.
“They needn’t have worried,” says Julia Forrest, one of the portfolio managers behind BT Investment Management’s listed property strategy. “That space that was doing $30 million is now doing $100 million,” she estimates. “It’s a buzzing centre, it was an amazing opportunity to transform what was an old, tired centre into a food hub with lots of services, some mini-majors, that has just driven traffic through the roof.
“If Myer wants to close some boxes there’s certainly opportunities across the portfolios to really invigorate that space.” As many as 19 of Myer’s 63 stores could close or shrink, the department store has flagged. “I’m sure they’re looking at other spots where maybe Myer won’t renew and are thinking the same thoughts.”
Forrest and Pete Davidson, who is BTIM’s head of listed property, heard the drums beating about Amazon’s arrival in Australia many years ago. And while they do not take the seriousness of this threat lightly, they argue the property sector has not got enough credit for how it is responding.
“This is the long game, it’s probably going to be a 30-year game.”
“What people probably underestimate is the response from the shopping centre industry. The ability to use technology to improve the shopping experience be it parking or be it what’s offered to customers, that’s something that isn’t in the equation at the moment,” says Davidson. “This is the long game, it’s probably going to be a 30-year game.”
Westfield Group, which the fund is overweight, surged last week as global interest in top mall operators returns. New York-listed General Growth Properties was linked to buyout talks with its major investor, Brookfield, but Davidson says sentiment towards Westfield had already been turning.
“There’s been a lot of circling interest in the stock, which needed a catalyst. Most people accept that there’s a great NAV or asset value uplift that’s coming there through the developments such as Croydon, Milan and most recently Century City,” he says. “Also US retail is recovering. Really the market’s just looking for some guidance for next year, which we’ll probably get at the AGM in February.”
However, they do not share the same confidence for “B-grade” office and “B-grade” malls.
‘Shrink more to greatness’
The US mall experience is useful in approximating Amazon’s impact but it is flawed too. American malls do not have supermarkets as anchor tennants because grocers, as they are known, are located on “strip” shops.
“There are some areas of weakness, obviously discount stores and department stores, which are probably going to shrink more to greatness,” says Forrest. “But the generation of foot traffic going to supermarkets – if you’re doing two visits a week, you’re generating a massive amount of foot traffic that you don’t see in the US.”
Davidson thinks the Amazon factor peaked when it acquired Wholefoods. “But if you follow it at the moment, Amazon are actually withdrawing some of their fresh offer across nine states in the US because it’s quite hard to make it work,” he says. “Yes it’s a concern but I don’t think it’s terminal. If you assume that Amazon got 3 per cent share of Australian retail sales in the next few years that’s roughly equivalent to $9 billion, which equates to the sales of Big W.”
Before funds management, Davidson started out as a treasury dealer with Midland Montagu. Forrest was investigating organised crime. They have been at BTIM 23 and 15 years respectively.
The strategy is reducing office exposures, but they note the incredible levels that assets are changing hands at because of the influx of offshore money.
“B-grade office is selling 19, 20 thousand [dollars] a square metre, which is above replacement cost,” Forrest says. Even so, “the [listed] sector’s actually cheaper than buying direct, you can access better quality assets in the sector cheaper than if you were to go to the direct market and you obviously don’t have any transaction costs.
“If you were to go buy an office building on this street [in Sydney’s financial district] you might be paying 4, 4.5 per cent and you can buy a vehicle that may be yielding 5, 5.5 per cent with growth and obviously you don’t have to manage it yourself.”
In New Zealand, they own Precinct Properties and Vital Healthcare, and in childcare, another sector they like, the fund owns Arena and Folkstone. “The working for families initiative means there will be a big release of government payment next year to boost the sector and it’s also defensive and reliable,” Davidson says.
Strong assets
Mirvac is the fund’s largest stock overweight at the moment. It “has got some of the best earnings growth in the sector, very good management team, great ESG, good office portfolio,” Davidson says. Its retail assets are in “really strong urban locations” that are not experiencing as sharp wage pressures as elsewhere in the economy, according to Forrest.
Beyond Westfield and Mirvac, the third main overweight position is Charter Hall, which is exposed to rising asset values in office and industrial.
“Like most property tragics, we end up with phones full of photos of shopping centres,” says Davidson, who scrolls through hundreds of images of shop fitouts and al fresco dining areas.
The discussion has turned to Stockland Wetherill Park in Western Sydney, a property where Stockland has also utilised rooftop solar targeting 1,200,000 kWh annually.
“They’re recreating a little bit of a Melbourne vibe, it’s like a Melbourne laneway in Wetherill Park. And you can do that, it’s got a nice inner-urban feel about it,” says Davidson.
“It’s worth noting they focus a lot on walkability within their new subdivisions so that’s great, you can only admire that. They’re looking at the whole issue of a better sense of community, a better sense of belonging, more exercise and better health outcomes.”
In terms of assets, he also rates highly Scentre Group’s Chermside – “Brisbane’s Chadstone” – and North Lakes, another Queensland attraction. Mirvac’s 200 George Street gets the tick as an innovative office property, and Goodman’s logistics joint venture out at Oakdale is “in some ways the mall of the future”. He has also been to an Amazon distribution centre in Shanghai, which spanned 400,000 square meters or two-thirds of the size of the Pentagon.
“It could be New York, London or it might be Maitland. We’re there.”
Forrest nominates Westfield London as the best shopping centre in the world, “in terms of curation, presentation, market presence, domination, transport and keeping it relevant and dynamic”. She also recommends the Tramsheds foodhall at Harold Park in Sydney, a Mirvac project linked to its residential development.
“You know you’re passionate about a job when you do it for free, it’s so interesting,” says Forrest. At Westfield Stratford City, another Westfield property in the UK, shoppers can only walk in one direction on the busiest trading days because the mall is so congested, she says.
“We’d categorise the market into fortress malls, and alternatively, safe neighbourhood. It’s the piece in the middle which is a little bit riskier,” says Davidson. “There’s risks there, but I think largely in the price.”
In the next couple of weeks he is going to Maitland to look at a new Stockland shopping centre. “It could be New York, London or it might be Maitland. We’re there.”

The importance of diversifying your diversifiers
We understand advisers are responsible for deciding how client assets are spread across markets. We know different advisers draw on different resources to determine how asset allocation decisions are taken, and how allocations are monitored and re-balanced.
It’s important for advisers to stress test the capabilities of those they rely on to help decide a client’s asset mix. Do they have the time, tools and experience required? Are their processes proven across the investment cycle?
We believe advisers should think about ‘diversifying their diversifiers’, meaning they should consider a combination of resources to ensure portfolios are properly structured and managed to meet client goals.
One enduring way to effectively – and efficiently – manage at least part of the asset allocation process is through the use of multi-sector funds.
Multi-sector, multi-purpose
Multi-sector funds remain a popular choice with as the nucleus of broader, more complex portfolios. Multi-sector managers employing active management between asset classes can serve as an ‘auto-tilt’ outside periodic reviews and guard against portfolio drift. Actively managed multi-sector funds can also be a good complement to passively managed allocations.
There is also ongoing demand for self-contained investment solutions for lower balance clients or clients with a lower level of sophistication. Multi-sector funds can achieve most (or even all) of the investment needs of these client types, where advisers can efficiently entrust the strategic and tactical allocation within and between asset classes to experienced investment teams with proven processes.
Solutions available
BTIM actively manages a suite of multi-sector portfolios. BTIM’s Diversified Strategies team assess the longer term outlook across all major markets and tactically adjust sector allocations in a disciplined and efficient way. Active investment management is then used within each investment sector and investors access capabilities including those managed by BTIM’s Crispin Murray, Vimal Gor and Ashley Pittard.
So in the one fund clients can obtain extensive diversification, active management at the fund and sector levels and value for money.
Talk to your Pendal Key Account Manager today for more information.

We think getting the country calls right is the biggest driver of successful investment in emerging markets. Currently India is one of our two favourite emerging markets, with both a strong trend growth rate as well as potential for a cyclical recovery in the Indian economy. The near-term potential is from an upswing in the credit cycle combined with fiscal support.
In recent years both private sector credit/GDP and the loan/deposit ratio of the banking system have declined as the Indian economy has de-levered, most notably through an undershoot of private sector capital investment and restrained consumption growth. This decline in leverage stands in marked contrast to the ramp-ups of credit seen in some other emerging markets. More recently, inflation has come in below expectations, giving the central bank policy flexibility. We feel the Indian economy resembles a coiled spring waiting to be released.
Government can be the trigger that unleashes the spring.
We have also been expecting the government to provide fiscal support for both consumption and investment ahead of the 2019 election. In addition, we consider the Modi administration to be the most pro-reform government in any emerging market right now, and see some of the policies (eg tax reform, infrastructure investment and improvement, switch to cash benefits for the poorest citizens) as providing direct and visible uplift to economic growth. Government can be the trigger that unleashes the spring.
A double helping of good news
Recently we saw two major developments in India that only add to our optimism over the Indian economy and, by extension, Indian equities. The first was the announcement of a recapitalisation of the state-owned banks of approximately US$32 billion over the next two years (US$20 billion through recapitalisation bonds sold by the government to the banks and then reinjected as equity, cleverly avoiding any liquidity impact, and US$12 billion directly from the fiscal budget). This is by far the most significant move of any recent Indian government to tackle the under-capitalisation of the state-owned banks. Banking sector stocks reacted accordingly with sharp upward moves.
The second, which has received less attention than the bank news, was the announcement the same day of a US$105 billion five year road-building plan to improve transport infrastructure to allow the economy to more fully benefit from the liberalising effects of the national goods and services tax (GST). These steps, we feel, are indicative of a government keen to ensure that the positive effects of its reforms are felt before the election.
Above-average valuations justified
Whilst Indian equities are not cheap in an absolute sense, the premium they attract over the average for emerging markets is slightly below its normal level, and we feel that the very strong growth opportunity and the prospects for further reforms justify current valuations. We remain heavily overweight Indian equities, with a focus on domestic sectors including, notably, banks.
Read more
Learn more about the importance of country allocation
Understand the advantages of emerging market equities
Corporate Australia delivered earnings growth of 18% in FY17, with the market relying on Resources to do most of the heavy lifting. Disruptive and cyclical challenges remain a defining feature, but a pick-up in capex, a controlled housing slowdown and increased infrastructure spending suggest an improving economic landscape. Australian equities retain support from liquidity and dividend yield, with lucrative opportunities available to the engaged, active and agile investor. With all this in mind, in this update BT Investment Management’s Head of Equity Strategies Crispin Murray provides his views on the outlook for Australia’s economy and equity market.
Economic outlook
We are more sanguine about the economic backdrop following the August reporting season than was the case six months ago, for three reasons. The first is that, at this point, the slowdown in housing appears to be orderly and is not providing the headwind to economic growth that some feared. This factor demands close observation however, with employment strong and interest rates low, the backdrop is relatively benign.
The second factor is that headwinds from declining capital expenditure have abated and capex should begin to be a more positive contributor to growth.
S&P/ASX 200 ex-financials FY18 expected capex spend
There is a balance to be struck here, as it has been capex discipline which has allowed companies to generate cash flow, de-risk balance sheets, and increase payouts in an otherwise sluggish environment. Nevertheless, signs that companies are starting to spend provides a tailwind for the broader economy that we have not seen for some time.
The third component is the pipeline of infrastructure as governments roll out a programme of road, rail and metro projects. This has been well telegraphed and has a long lead-in time, but there are now signs that we are moving into a significant uplift in spending. This is coming at a point where mining companies are no longer scaling back on investment, providing a tailwind for employment and activity, which, again, has been missing for some time.
As active managers, this is a fertile environment. Uncertainty creates mis-pricing – and mis-pricing creates opportunity.
Market outlook
From here, we expect more of the same: a mid-single digit return, driven by earnings. A reasonably cautious unwinding of European QE and only marginal tightening from China means that liquidity is not a headwind. The market is also enjoying support from the significant yield premium it enjoys over bonds. At this point, with little sign of recession and absence of some geopolitical shock, we see the market able to hold its valuation rating. This leaves earnings as the market driver, with consensus expectation of +7% for FY18.
Crucially, we believe we are at an inflection point in Australian equities. The dominant trend of recent years – falling bond yields, which fuelled a surge in defensive yield and growth stocks – has waned and bond yields now look range-bound. Chinese policy remains supportive of resource stocks, but is no less opaque than in the past and its future direction rests on the political transition in October. Oil prices likewise look range-bound, with Saudi Arabia’s efforts to cut production and raise prices nullified by production increases from non-OPEC countries. At the same time, we have a market facing unprecedented disruption in the form of new technology, competition, and regulation, which is providing structural challenges to long-standing Australian oligopolies.
Uncertainty creates opportunity
In short, uncertainty abounds. Themes and trades which have been ‘one-way’ in recent years are no longer. Many companies which have done well are looking challenged. As active managers, this is a fertile environment. Uncertainty creates mis-pricing – and mis-pricing creates opportunity. In this environment there will be divergence between sectors and, crucially, divergence between companies within the same sector.
This is where the ability to scour the entire market for opportunities comes to the fore. This is where the opportunity to meet management, gauge their strategy and quality, and to assess their ability to navigate a tricky environment become crucial for an investment outcome. We remain mindful of the challenges and cognisant of the uncertainty, however we believe that our bottom-up, fundamental approach employed by one of the largest teams in the Australian market, is positioned to do well.
31 October 2017
BT Defensive Equity Income Fund (APIR: BTA0427AU, ARSN: 159 947 298) – Important information
Reduction in management costs from 1 November 2017
With effect from 1 November 2017, the Fund’s management costs will reduce.
The management costs are currently made up of an issuer fee of 0.99% pa and an expense recovery of 0.15% pa. The issuer fee will reduce to 0.75% pa and the Fund will no longer charge expense recoveries.
Changes to the Fund’s investment strategy from 1 December 2017
Following a recent review, we will be changing the Fund’s investment strategy with the aim of enhancing the Fund’s ability to perform in a range of different market conditions.
The Fund invests primarily in an actively managed portfolio of shares in the S&P/ASX 200 Index and uses options and other derivatives to generate income and reduce market risk. The Fund’s portfolio is constructed using three key steps.
From 1 December 2017, the Fund’s portfolio construction process will comprise the following steps:
1. Investing in a selection of shares in the S&P/ASX 200 to generate income from dividends. The portfolio will generally include 20-60 companies, with a bias towards high dividend yielding stocks with franking credits based on our positive, fundamental company analysis. BTIM’s fundamental company analysis focuses on four key factors: valuation, franchise, management quality and risk factors (both financial and non-financial risk);
2. Selling call options over some or all of the shares in the portfolio and/or the S&P/ASX200 Index to generate certain income from option premiums in exchange for forgoing a significant component of the potential gains on the share portfolio. Any share call options sold will be fully backed by holding the shares in the portfolio; and
3. Buying put options over the S&P/ASX 200 Index and specific shares held in the portfolio with the aim of significantly reducing the Fund’s downside market exposure.
How is this different to the current portfolio construction process?
The new portfolio construction process enables the portfolio to generate income from option premiums, by selling call options over some or all of the shares in the portfolio as well as the S&P/ASX 200 Index, instead of selling call options over all the shares held in the portfolio. This change allows the portfolio greater flexibility to tailor exposure to where BTIM believes the best risk/reward benefits lie. For example, where BTIM’s analysis indicates the medium to long term outlook of the share outweighs the premium that would be received from selling the call option, the portfolio would have the ability not to sell the call option over the share.
The portfolio construction process will now also include buying put options over specific shares held in the portfolio, in addition to the current portfolio construction process of buying put options over the S&P/ASX 200 Index. The current process of buying put options over the S&P/ASX 200 Index protects the Fund against broad downside market exposure, but not all sectors and stocks perform in line with the index. The ability to buy put options over specific shares is expected to better protect the portfolio from sector and stock specific downside exposure.
The Fund will continue to invest in a selection of shares in the S&P/ASX 200 Index and generally hold 20-60 companies with a bias towards high dividend yielding stocks with franking credits. As the Fund can now sell options over the shares in the portfolio and/or S&P/ASX 200 Index, this reduces any potential bias in the portfolio towards shares whose options are more liquid.
The overall exposure limits of the strategy are not affected and we do not expect any material change to the Fund’s risk return profile. Furthermore, there is no change to the Fund’s investment return objective.
31 October 2017
Pendal Balanced Equity Income Fund (APIR: BTA0428AU, ARSN: 159 947 270) – Important information
Reduction in management costs from 1 November 2017
With effect from 1 November 2017, the Fund’s management costs will reduce.
The management costs are currently made up of an issuer fee of 1.39% pa and an expense recovery of 0.15% pa. The issuer fee will reduce to 0.88% pa and the Fund will no longer charge expense recoveries.
Changes to the Fund’s investment strategy from 1 December 2017
Following a recent review, we will be changing the Fund’s investment strategy with the aim of enhancing the Fund’s ability to perform in a range of different market conditions.
The Fund invests primarily in an actively managed portfolio of shares in the S&P/ASX 200 Index and uses options and other derivatives to generate income and reduce market risk. The Fund’s portfolio is constructed using four key steps.
From 1 December 2017, the Fund’s portfolio construction process will comprise the following steps:
1. Investing in a selection of shares in the S&P/ASX 200 to generate income from dividends. The portfolio will generally include 20-60 companies, with a bias towards high dividend yielding stocks with franking credits based on our positive, fundamental company analysis. Pendal’s fundamental company analysis focuses on four key factors: valuation, franchise, management quality and risk factors (both financial and non-financial risk);
2. Selling call options over some or all of the shares in the portfolio and/or the S&P/ASX200 Index to generate certain income from option premiums in exchange for forgoing a significant component of the potential gains on the share portfolio. Any share call options sold will be fully backed by holding the shares in the portfolio;
3. Buying put options over the S&P/ASX 200 Index and specific shares held in the portfolio with the aim of significantly reducing the Fund’s downside market exposure; and
4. A hedging strategy may also be applied to reduce the adverse impact of extreme market movements caused by significant global events that are expected to occur infrequently. The strategy uses derivatives over international share indices and volatility indices that generate profit when share markets experience large negative movements. This is based on our fundamental view that movements in share markets globally are closely correlated when significant global events occur.
How is this different to the current portfolio construction process?
The new portfolio construction process enables the portfolio to generate income from option premiums, by selling call options over some or all of the shares in the portfolio as well as the S&P/ASX 200 Index, instead of selling call options over all the shares held in the portfolio. This change allows the portfolio greater flexibility to tailor exposure to where BTIM believes the best risk/reward benefits lie. For example, where BTIM’s analysis indicates the medium to long term outlook of the share outweighs the premium that would be received from selling the call option, the portfolio would have the ability not to sell the call option over the share.
The portfolio construction process will now also include buying put options over specific shares held in the portfolio, in addition to the current portfolio construction process of buying put options over the S&P/ASX 200 Index. The current process of buying put options over the S&P/ASX 200 Index protects the Fund against broad downside market exposure, but not all sectors and stocks perform in line with the index. The ability to buy put options over specific shares is expected to better protect the portfolio from sector and stock specific downside exposure.
The Fund will continue to invest in a selection of shares in the S&P/ASX 200 Index and generally hold 20-60 companies with a bias towards high dividend yielding stocks with franking credits. As the Fund can now sell options over the shares in the portfolio and/or S&P/ASX 200 Index, this reduces any potential bias in the portfolio towards shares whose options are more liquid.
The overall exposure limits of the strategy are not affected and we do not expect any material change to the Fund’s risk return profile. Furthermore, there is no change to the Fund’s investment return objective.
An update on the Techs and the real story inside Intel’s secret chip society

In our recent research trip we met with a range of CEOs, CFOs, operational heads and investor relations contacts at companies in London and across multiple cities in the US (San Francisco, Santa Clara, Las Vegas). On this trip we focused primarily on our technology-related businesses based in the US, leisure resorts, global pharmaceutical, European financials and small to medium cap companies listed on the London Stock Exchange. While our primary interest was on specific operational updates from our investee companies, we also widened the lens to see how the small to medium end businesses were coping with the fallout from Brexit and uncertainty in the UK and European economies.
“the world is on the mend and the Technology industry is well positioned to benefit”
Ashley Pittard, Head of Global Equities
In an overall sense, our broad range of meetings (sample list below) continue to reaffirm our belief that the world is on the mend and the Technology industry is well positioned to benefit. We believe investors will be well rewarded by taking a genuine long term approach to allocating capital to the Technology sector and the Pendal Concentrated Global Equity Fund has over 20% invested in such positions.
Company meetings – September 2017

We currently own names in software, analogue circuits, semiconductor producers and associated equipment manufacturing businesses in our portfolio. Regular readers of our fund commentaries would be well aware of our views on technology so in this edition we provide a deeper insight into Intel, one such semiconductor business we hold today.
____________________________________________________________________________________________________________
Intel Corporation – chipping away at a much bigger prize 
In a nondescript building in Santa Clara which belies its place in history sits the global headquarters of Intel, the world’s largest semiconductor company. Intel is credited with developing the world’s first ever microprocessor chip in 1971. This microprocessor went on to become the building block that engineers could purchase and then customise with software to perform different functions in a wide variety of electric devices. The microprocessor is the central processing unit (CPU), or the ‘brain’ of a computer. In 1971 this microprocessor the size of a thumbnail was considered revolutionary in that it delivered the same computing power of the first computer built in 1946, which filled an entire room. Since then, Intel has been instrumental in developing increasingly more powerful microprocessors without increasing the size of the chip. Today, microprocessor chips power data centres, PCs, smartphones and a myriad of other electronic devices that we use in our daily lives. Microprocessors are now being designed for a wide range of specific applications.
Chips simply roll off the production line, right?
Designing and manufacturing the ‘brain’ of the computer is actually an intricate, time consuming and expensive task and becoming increasingly so. Consumer demand for automated driving, connected home devices, robotics and virtual reality capabilities among other things require significantly more chip ‘brain’ power. While they appear to be flat, chips are actually three-dimensional structures and may include as many of 30 layers of complex circuitry. The design and manufacture of a chip can typically take around five years. Clearly, the business of producing microprocessors is anything but simple.
“It takes longer to assemble a microprocessor than it does a Boeing aircraft”
Sue Scott, Senior Investment Analyst
Chips are made by creating tiny patterns on a polished 12 inch silicon disk (wafer) using a process called photolithography and depositing very fine layers of material on top. The wafer itself is a thin slice of semiconductor material (silicon). The most sophisticated processor can contain millions (or billions) of transistors interconnected by fine wires made of copper. Each of these transistors act like neurons in the brain controlling the flow of electricity through the chip to send, receive and process information. After typically more than 2000 steps of lithography, etching and material application, the wafers are transformed into microprocessors. Each is then cut into many thumbnail sized ‘dies’, which are individually placed in a ceramic enclosure. The ceramic package protects the die and delivers power and electrical connections when placed directly into a computer circuit board or mobile device. By comparison, it takes longer to assemble a microprocessor than it does a Boeing aircraft!
Check out the following video to see how chips are produced
In 1971 the revolutionary Intel microprocessor held 2300 transistors; today there are over 7.2 billion transistors in Intel’s Broadwell-EP Xeon microprocessor. The circuit line width in the original model was 10,000 nanometres (one billionth of a metre); today Intel are manufacturing 14 nanometre microprocessors, implying significantly more ‘brain power’. To put this in context, an average human hair is 100,000 nanometres wide.
The scale and complexity of chip design requires specialised, tightly controlled manufacturing processes. And Intel is one of the few semiconductor companies who manufacture their own product rather than outsourcing the production to a foundry.

The microprocessor chips are manufactured in a factory, or what is referred to in the industry as a ‘fab’. The Intel manufacturing fabs in the US, China, Ireland and Israel are a far cry from what one may imagine a factory floor to look like. The fabs themselves cost over US$8.5 billion to build and are state of the art facilities fitted out with machinery worth in the hundreds of millions. Before entering one of these fabs, often referred to as a clean room, technicians need to have cleaned their hands and face as make-up, perfume and other cosmetics are forbidden. They are then required to don what has been called a bunny suit to enter a pressurised room that sits between the outside world and the clean room. The suit covers the whole body and includes gloves, safety glasses and a mouthguard. The air in the clean room is what is called Class 10 purity, which means for every cubic foot of air there can be no more than 10 particles larger than half a micron, which is about the size of small bacteria. To put that in context, in a hospital operating room there can be as many as 10,000 bacteria size particles in a cubic foot of air, and in the outside world there are about 3 million. Manufacturing their own products provides Intel with the ability to optimise performance, reduce operating costs, shorten time to market, and enable them to scale new products quickly – a distinct advantage over competitors in the industry.
Examining the investment case
Considering the vast intricacies and associated manufacturing costs for chip makers, can investors achieve a decent return from Intel? Our response is an emphatic “yes”. In 2016 the worldwide semiconductor market reached a record value of $334 billion. According to Gartner, an independent technology industry research firm, the industry is continuing to grow at a double-digit rate in 2017. This view was certainly reinforced by the semiconductor companies we met on our most recent research trip.
Intel holds the number one share in the semiconductor market, a position it has held since 1992. Intel reported full year revenues for the last fiscal year of a record US$60 billion with gross margins above 60%. However, despite the impressive metrics and the strong underlying industry fundamentals, Intel’s share price has lagged the Philadelphia Stock Exchange Semiconductor Index (up by over 30% for the calendar year to date). More recently, Intel’s shares were trading on a 2018 price to earnings ratio of around 13x which is a discount of approximately 20% to the S&P500 market multiple.
Why the underperformance?
About 55% of Intel’s microprocessor revenues are PC related, where Intel commands a market share of over 80%. In 2016 global PC sales fell for the fifth consecutive year and continue to see declines in 2017 as consumers move to mobile devices such as laptops and smart-phones. The consensus view is that Intel are not only vulnerable to falling revenues in their PC division, but also margin declines as new competitors look to take market share. Interestingly however, despite declines in global PC sales, Intel managed to grow their PC-related revenues in 2016 by around 2% and sales continue to outpace broader market declines this year.
Responding to the revenue challenge
Intel’s management are realists and they expect global PC sales to continue to crimp growth. Strategically they have identified ‘the cloud’ as the most important trend in shaping the future of technology. According to Intel, the cloud will enable a change in the relationship individuals have with technology, as appliances and devices become increasingly connected to each other. Product development is now increasingly focused on the strategic goal of transforming the business into one which is less reliant on growth from PC-related revenues and more leveraged to growth from the cloud. The significant amounts of computing power required for this industry transformation play to Intel’s strength.
Technology innovation is embedded in the company’s DNA, as is the ethos echoed by former CEO, Andy Grove, that “only the paranoid survive”. Being the leader in revolutionary technology is the objective, hence the relatively high 20% of sales revenue spent on research and development. Growth in the data centre division, which best reflects their cloud strategy, has been in the high single digits in the last two years and accounted for around 30% of revenues in 2016.
2017 has seen a myriad of new product launches, primarily targeted at cloud customers. These new product launches along with the product pipeline are positioning Intel to be a leading supplier of chips not only in PCs, but extending to cloud applications, automotive and 5G communication industries.
“Start with a growing market. Swim in a stream that becomes a river and ultimately an ocean. Be a leader in that market, not a follower, and constantly build the best products possible.”
Robert Noyce, Intel’s co-founder and co-inventor of the integrated circuit
The market has been justifiably concerned about declines in PC business and a share price that is little changed in three years. In our view, Intel have done well to maintain PC revenues and margins amid the declining market and have concurrently been transforming the company from being PC-centric to a data-centric powerhouse. As shareholders, we understand this sort of transformation takes time and investment, and we do not think current share prices give credit to a company that is maintaining a meaningful PC business in challenging conditions, whilst at the same time positioning the broader business for long term growth. While this transformation progresses, we have seen the opportunity to buy the market leader in semiconductors at an attractive valuation with a thesis that is supported by evolving revenue sources. Considered together with a solid 3% dividend double the rate of its sector peers we are being paid to wait for the new revenue streams currently sitting deep within the sanctity of the fabs.
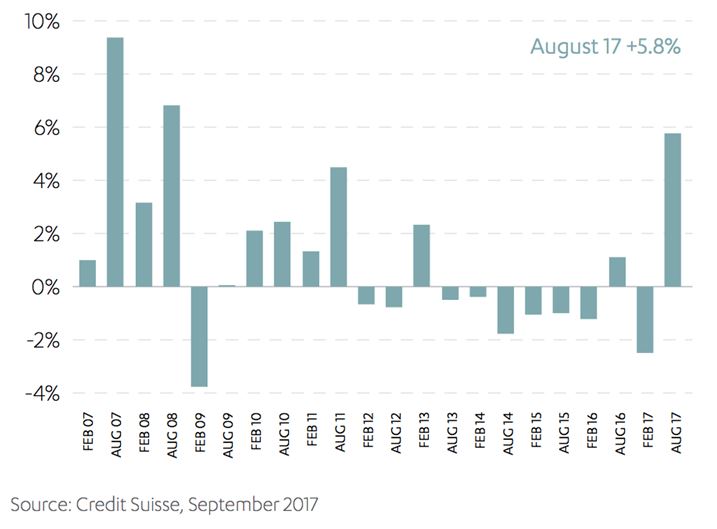
Inflation for the September quarter came in marginally lower than expected at 0.6% headline and 0.4% underlying. This leaves annual headline at 1.8% and underlying at 1.9%.
Whilst the headlines were grabbed by the expected sharp increase in Electricity prices (+8.9%) and sharp decline in Vegetables (-10.9%) these are trimmed away in the underlying numbers, where the RBA focuses. Food, beverages and tobacco make up 24% of CPI so the majority of trimming is found in the sub items in these groups, both to the upside and downside. Throw in automotive fuel (3.55% weight) and the other “energy” called utilities (3.6%) and you are at the 30% mark, so we generally end up with the trimmed mean being effectively like the US underlying called “ex food and energy”.
Where could the RBA take some encouragement?
The main area the RBA would take some encouragement is in the performance of non-tradables.
Seasonally adjusted non-tradable inflation was the highest since Q3 2013 at 0.86%. The lower inflation number was again due to tradable deflation being at its lowest since Dec 2014 at -0.78%. In fact tradable inflation has been flat net on net since March 2014. In the same period non-tradable is up 8.7%. The RBA only really influences non-tradable inflation and is a price taker of tradables. Therefore, if there were to be some global inflation generated by the pick-up in global growth this year, it would feed through to Australia’s inflation outlook.
Chart 1: Tradables inflation continues to lag its non-tradables counterpart
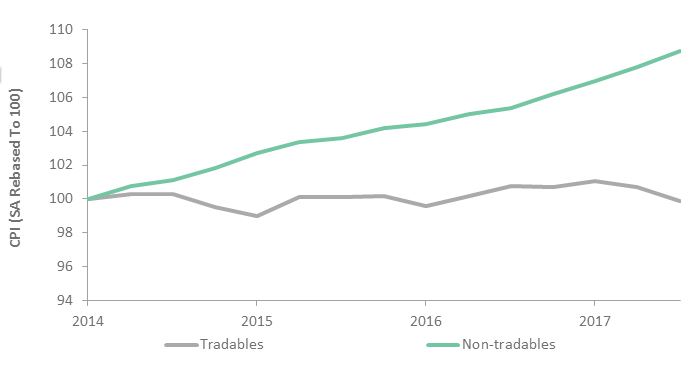
Source: ABS
The second area of encouragement is housing. Of the 70% of CPI which generally makes up underlying inflation, housing dominates. Rents (6.7%), New Dwelling Purchases (8.67%) and Maintenance and Repair (2%) are 17.3% of overall CPI, but therefore usually 25% of underlying. So any big theme in housing should drive underlying inflation. In this regard there are a few early but encouraging signs. New dwelling purchases were up 0.8% q/q and 3.1% y/y, showing ongoing high housing construction numbers are having an impact. Rents remains subdued overall, but vary across major cities. Increases are relatively strong in Sydney, healthy in Melbourne but turning negative in Brisbane as the much talked about oversupply bites. Perth should see some recovery from recent declines. Continuing strong immigration numbers should see rents hold up in general.
Delving deeper into the capital cities, the major drag on inflation has been from Perth and Darwin (less than 1% CPI annually). Brisbane has begun to recover and given recent employment data there are hopes Perth and Darwin may follow. Adelaide and Hobart have largely caught up with Sydney and Melbourne (at around 2%), which highlights reason for hope. Although not a major change, the recovery of the mining states could see inflation settling back in the lower end of the 2-3% band.
What would discourage the RBA?
The breadth of low inflation is the main area of concern. The ANZ Diffusion Index showed only 26% of items had a quarterly annualised price increase of 2.5% or more. The main culprits were again retail-led, with a majority of items experiencing falling prices. The AUD was stronger across the majority of the quarter and is currently weakening but recent experience has shown little currency impact on goods prices. Much has been written about structural changes in retail and the evidence suggests it will continue to weigh on inflation for a number of years yet.
Where does this leave the RBA?
The RBA will remain on a watching brief into 2018. The wage data on 15 November will be the next piece of information and given the minimum wage increase of 3.2% hits the Q3 numbers, it should show an uptick. Whether this feeds into inflation immediately is doubtful, but it would help the narrative of a slow but gradual pick up in prices, which took a hit with the CPI numbers. As there is no January RBA meeting they will have the Q4 CPI numbers (due out 25 January) by their first 2018 meeting and for their February bi-annual Parliamentary Economics Committee Update. They will likely want to open the New Year on a positive note, but the Q4 CPI numbers will hold the key as to whether that positive note may include firmer hints of tighter monetary policy into 2018. With other central banks easing back from monetary stimulus, the RBA would be hoping to follow suit at some point in 2018. We will be watching closely for clues as to when that might be.
“KOSPI-listed Firms’ Dividend Surpasses 3 Trillion Won in First Half”
Business Korea, 4 October 2017.

Seoul, South Korea at dusk
We have been overweight Korean equities since the end of 2012, finding the combination of strong corporate growth, attractive valuations and corporate governance reform an attractive proposition. The portfolio has benefited from this position, both through a modest positive performance contribution from the country allocation, and a very substantial contribution from stock selection in Korea.
Our view has been focused on Korean exporters (that also meet our valuation and corporate governance requirements), but that view is changing. At the end of 2016 Korea saw a major corruption scandal that led to mass protests, the impeachment of then President Park Geun-hye and an election in May 2017. That election returned a more liberal/left-wing administration under President Moon Jae-in, and is a significant contributor to our widened area of opportunity in the Korean equity market.
The stand-out feature of Korean equities is how cheap they are. On an industry-neutral basis, the cheapest markets (on a price/earnings basis) in the emerging world are Russia, Greece, Pakistan and Korea. Three of those face serious economic and/or political challenges; Korea does not. Korean equities are cheap because those earnings do not translate into dividends. Corporate Korea has the lowest payout ratio of any major market in the world, because a lack of effective oversight allows company managers to simply hold cash back from shareholders.
The cheapest markets in the emerging world are Russia, Greece, Pakistan and Korea. Three of those face serious economic and/or political challenges; Korea does not.
To put some numbers on this, in 2016 the non-financial companies in MSCI Korea paid out KRW 15.7trn (USD 13.5bn at 2016 exchange rate) in dividends on an earnings base of KRW 71.5trn, a 22% pay-out ratio. Those dividends look even less generous when one considers that those companies generated KRW 143.2trn in cash-flow from operations and had a capital expenditure of KRW 95.6trn. The resultant KRW 47.6trn in free cashflow is potentially entirely available to pay out as dividends, which would increase the dividend yield on non-financial MSCI Korea from the current 1.4% to 5.0%. Five-year government bond yields in Korea are 2.0% for comparison.
Incredibly, there can and should be more. The net debt/equity of these companies is 10%, making Korea one of the least-levered markets in the world. The emerging market average for non-financial companies is 27.8%, implying that a further KRW 167.6trn of dividends (representing 17.8% of market capitalisation) could also be paid out through more efficient capital management.
The behaviour of corporate Korea and the related lack of dividends has become an increasing issue in Korean politics, as an ageing population needs income from its investments. We feel that both the Korean public’s response to the corruption scandal, and the resulting election of a left-wing administration, will put huge pressure on Korean companies to reform, and that this will be the catalyst to unlock much of the hidden value in the Korean equity market.
Crucially, though, and in line with our investment process, we feel this creates opportunities within Korea rather than making a case to own every stock in the market. Firstly, financial companies have been excluded from this calculation as this is not a useful analysis. Secondly, Korea does contain a few horribly over-leveraged businesses (Korean Air Lines, for example, has a debt/equity ratio of 780% and net debt/ equity of 5.1x). As always in emerging markets, it pays to be selective.
Volatility leads high yield spreads lower

We have been living in a low-volatility world for a while now, driven by a massive alphabet soup of central bank liquidity which has been delivered globally. If it’s not the Fed engaging in QE’s 1, 2 and 3, it’s the ECB’s PSPP and CSPP bid, BoJ’s QE and yield curve control, or simply the massive stimulus delivered by the PBoC. But the persistence of low volatility and low yields is also thanks to what seems like a Goldilocks global growth picture. The US economy has put in a sufficient recovery over the last year such as to allow the Fed to have hiked three times without much ado from the markets. Similarly, European growth hasn’t been that stellar since the Eurozone sovereign crisis, which put most of the continent into a coma for the last five years. And of course, against all devaluation expectations, the Chinese Yuan and economy have both charted a firm and steady course so far this year.
Put it all together, and you have a global economy probably past its peak but not yet falling over, and activity levels that are holding up but not so strong as to warrant a sharp rise in interest rates. But what lies beneath may not be so Goldilocks. The economy is both ‘too hot’ (US labour market) and ‘too cold’ (global inflation), and it is precisely such opposing forces that currently result in a benign macro backdrop. In the tug-of-war between a Fed determined to pursue monetary normalisation and a stubbornly weak (or at least weaker than-expected) inflation picture, the yield curve has flattened and low-flation has won. Certainly after five disappointing US inflation prints, a belief has set in that we are now in a structurally lower inflation world, perhaps as a result of the success of inflation-targeting central banks.
It was only 18 months ago when the world was convinced that the US was headed into recession. By the start of 2016, WTI crude oil had found new lows in the mid-$20s, US GDP growth had more than halved in less than a year, and ISM PMIs were firmly in contractionary territory. Between mid-2015 and early 2016, US high yield credit spreads had almost doubled to 6 per cent. Concerns over the US being ‘late-cycle’ had quickly escalated into fears of the next US recession, and no investor wanted to touch US retail with a ten-foot barge pole.
Then, in what felt almost like an overnight move, things started to improve. We all know very well by now that the Chinese credit stimulus of late 2015 ‘made America great’ by delivering the impulse needed to avoid the next dip. Soft and hard data based as commodity prices lifted off their lows, and however late-cycle the US might have been then, the economy had once again peered over the edge but stepped back from the abyss. Asset volatility, risk premia, and credit spreads globally followed the US recovery, and the rest is history.