As the market digests The People’s Bank of China’s (PBoC’s) announcement late last week to scrap the 20% FX reserve requirement on Renminbi (RMB) FX swap and options transactions, it is all too easy to conclude that this necessarily means more volatility for the Chinese Yuan, and that the authorities are opposed to further RMB appreciation. It is unsurprising, therefore, to see knee-jerk reactions in both onshore and offshore RMB against the US dollar. However, as we have been arguing for some time, the analysis of China through the usual market lens results in black-and-white conclusions, when in fact the reality lies somewhere in between the extremes. Whilst the RMB has appreciated over 6% against the US dollar year-to-date, DXY has lost closer to 7%. On a trade-weighted basis, as reflected by the China Foreign Exchange Trade System (CFETS) RMB Index, the RMB remained weaker on the year until last week.
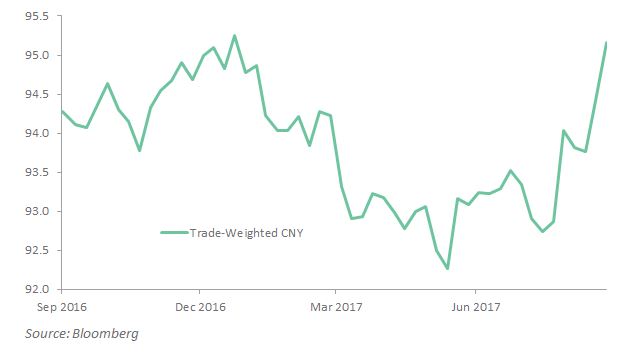
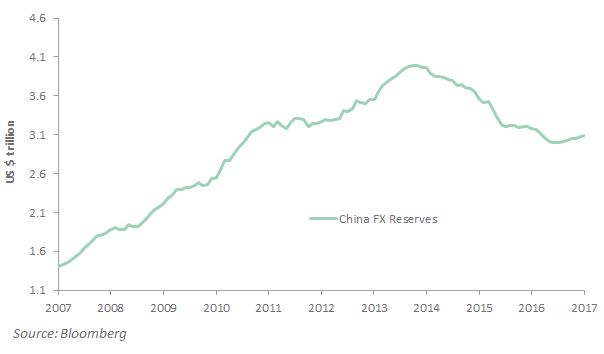
A more rapid pace of currency appreciation over the last month has been driven by a number of factors, including an increased desire by Chinese exporters to convert foreign currency back into RMB, as well as a growing onshore confidence in economic stability. Against the backdrop of Chinese FX reserves holding stable above the $3trn mark, and a local economy continuing to grow at 6.5% in spite of financial deleveraging and regulatory tightening, the relaxing of FX reserve requirements should not be mistaken for a desire to see a weaker currency by the PBoC. Rather, this position of strength provides an opportunity to build on the momentum of the Yuan gaining status as an international reserve currency. Recall that in July, MSCI finally granted inclusion of China A-Shares into the index. China hopes that such decisions which appear to allow free market forces to determine the value of its currency and will eventually lead to China’s inclusion in major global bond indices in time. Whilst these measures are unlikely to be enough, they certainly don’t hurt.
The removal of the 20% reserve requirement reduces the cost of hedging RMB currency risk, but does not by itself create an additional need to hedge. The public shaming of various Chinese corporates and their “conspicuous” offshore investments creates, if anything, a need to convert offshore proceeds back into RMB. Further, the reduction of hedging costs combined with initiatives such as Shanghai-Hong Kong Stock Connect and Hong Kong Bond Connect may in fact entice more foreigners into the onshore Chinese market. Similarly, the PBoC is rumoured to be contemplating the removal of the 17% Reserve Requirement Ratio (RRR) – the amount of cash that banks are required to hold – on major offshore banks’ RMB holdings onshore. This was also once a deterrent to betting against the Yuan, yet with recent CNH liquidity so flush, such a measure is unlikely to produce much response in spot FX rates, but succeeds in making China appear increasingly market friendly.
The PBoC is more concerned with the recent pace of RMB appreciation, rather than currency appreciation itself. Whilst the removal of the FX reserve requirement allows the currency to pause for breath, we believe it is not the PBoC’s intention to reverse the RMB’s course. As the Chinese economy transitions from a growth model reliant on old economy industries to one led by domestic demand, import growth is likely to outpace exports, as we have already started to see. Almost two-thirds of Chinese GDP growth this year has been driven by domestic consumption. A stronger RMB serves to benefit such an economic model, and isn’t it ever so helpful that it also appeases the Trump administration and its fixation on currency manipulators?

“The new configuration of [current-account] imbalances poses distinct global risks, particularly over the medium term.” IMF 2017 External Sector Report
As international investors in emerging markets, our focus is on US dollar returns, not local currency ones. This means an assessment of the outlook for the currency is an important factor to consider. In fact, it is one of the five main drivers of our investment process.
There are a number of ways to assess the over/under valuation of a currency relative to its long-term prospects. One is to use purchasing-power parity (PPP), which assumes that currency fair-values should reflect price differences between countries. The Economist’s Big Mac index is a simple and well-known example of this approach. Another approach, and one which we lean to, is to try to assess how a country’s current-account balance is moving relative to the strength of its economy and the relative prices of its imports and exports. Known as the external balance approach, we think it is of significant use, and is why we pay so much attention to current-account balances (as regular readers will be aware).
Of particular interest to us this month has been the IMF’s 2017 External Sector Report, released at the end of July, which contains IMF staff views on 29 leading economies, including 13 emerging markets. The IMF’s Consultative Group on Exchange Rates have developed sophisticated models that analyse the factors that contribute to a country’s equilibrium current-account balance, from which they can then assess currency valuations.
One of the main conclusions in the report is that the problematic current-account deficits in many emerging markets – particularly Brazil, Indonesia, South Africa and Turkey – have eased, largely on tighter fiscal and credit policies. Also gone, is the excessively large current-account surplus in China with correspondingly looser fiscal and credit policies. These serve to reduce the overall level of risk in emerging markets as an asset class.
Indeed, where the report sees concerning imbalances, it is in the sustained pattern of surpluses and deficits in the developed world. The report notes that fiscal consolidation supported the widening or persistence of excess surpluses in some key advanced economies (such as Germany and Japan; the Netherlands, Singapore and Sweden are similarly mentioned elsewhere), but did little to reduce excess deficits in other advanced economies (Australia, Canada, the UK and the US). The global risks from conflicts around trade and protectionism originate in the developed world.
That is not to say there is not the potential for large currency moves in some emerging markets. Our analysis agrees with the IMF’s views that the Korean won, Thai baht and Malaysian ringgit remain significantly undervalued and also that the South African rand is overvalued. The signals are more ambiguous on currencies nearer fair value, including the Chinese renminbi and the Indian rupee.
There is one significant risk which is perhaps underplayed in the report and overlooked elsewhere. Our analysis comes to the same conclusion, that the Saudi riyal is substantially overvalued and in need of a significant devaluation. As the currency is currently pegged to the US dollar, any such devaluation could be difficult both for Saudi citizens and for the nation’s financial system. Saudi Arabia is an otherwise interesting frontier market, but our long experience of emerging market investing makes us very wary of overvalued, pegged currencies.
In several recent pieces we have highlighted the risks involved in chasing returns in the high yield credit arena. Our August newsletter took a deep dive into the murky waters of US junk bonds and questioned whether the appetite for the area is sustainable. We also discussed why we believe the area is more vulnerable than its investment grade counterpart (see Degustation or decompression for credit investors? and High yield hunger games). These concerns have been echoed by the latest piece of negative news regarding beleaguered US retailer, Toys R Us, proving junk bond investing is not a matter of simple child’s play.
It was revealed this week that the retailer had engaged legal advice for restructuring US$400 million in debt due next year, which also puts the spectre of bankruptcy on the table. The issue underscores the broader structural challenges facing bricks and mortar retailers as the threat from deep discounters such as Walmart and online merchants like Amazon grows. Indeed, the latter has featured heavily in headlines over the past few months following its acquisition and planned price cuts for Whole Foods stores.
Chart 1: Toys R Us spreads skyrocket on bankruptcy speculation

The growing prevalence of e-commerce giants and the structural industry shift raises particular concerns for the US high yield space, where approximately 24% of the US CDX High Yield Index sits in the Consumer Discretionary sector. More than 10% of the sector operates in retail, supermarkets and department stores. This includes well-known operators like JC Penney, Sears and Neiman Marcus. Even before the latest Toys R Us development, the range of spreads in the retail industry was higher than any other, as shown in the chart below.
Chart 2: Traders perceive more risks in Retail than any other high yield area

“Not all credit is created equal”
Looking ahead, retailers are entering their most critical time of year as US shoppers prepare for the holiday season. This may explain the timing of the Toys R Us potential decision to restructure its debt. The period typically requires a large investment in inventories to meet expected demand. As such, its restructuring suggests it would prefer to avoid running down cash on its balance sheet and try to avert being pushed to the absolute brink of collapse. The decision may also serve as the canary in the coalmine for other stressed retailers as they face their most intensive part of the working capital cycle.
Our view remains that not all credit is created equal. Those investing in the high yield space face many hidden and growing risks. These are being increasingly reflected in key sector vulnerabilities. While retail faces its own problems, challenges continue for the energy and telecommunications sectors. As we witnessed in 2015 after energy prices plummeted, contagion effects stemming from the energy sector caused the broader high yield index to suffer dramatically. With several sectors now facing a raft of issues, the risks are rising that the crowd of high yield investors who have treated the asset class homogenously, will be hit again.
After a few small wobbles earlier in the year, the chase for yield has seemingly resumed, pushing US equities to record peaks and taking credit indices close to their most expensive post-GFC levels. This has seen many fixed interest managers reach further along the credit rating menu in the search for higher returns. The credit market is sufficiently diverse to cater to different investor tastes in terms of risk and return, however, behind the lure of the high yield area lie a number of not-so-hidden dangers of which every investor should be wary. In the following discussion we examine the case for spread decompression and the near term catalysts that render high yield debt more vulnerable.
One of these dangers is the evolving broader macroeconomic backdrop. For the first time in the post-GFC era, most of the world’s developed market central banks are on the path to policy normalisation. Critically, this is in the absence of a material pick-up in inflation and inflation expectations. In fact, both measures have actually fallen this calendar year as reflected in the chart below.
Chart 1: Inflation expectations have fallen
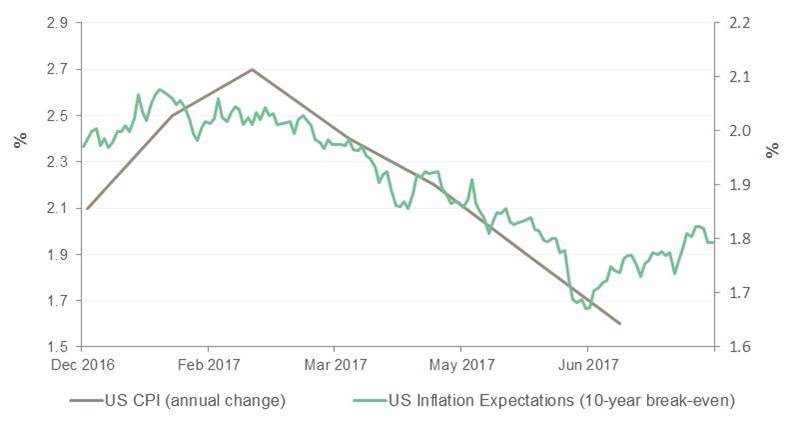
Source: Bloomberg
Historically, such declines in inflation expectations have been a negative for credit. This makes intuitive sense when we consider that inflation expectations also provide a gauge of sentiment towards future economic growth, which helps drive company revenues and how debt is serviced. It is important to make a distinction here between debt in the investment grade camp (BBB or above) and junk bonds (BB or below), also known as high yield. It is the latter camp that is the most sensitive to a shift in the economic landscape. The chart below illustrates that the spread between the difference in yield on junk and investment grade typically widens when inflation expectations fall i.e. junk bonds underperform.
Chart 2: Junk bonds underperform when inflation expectations fall
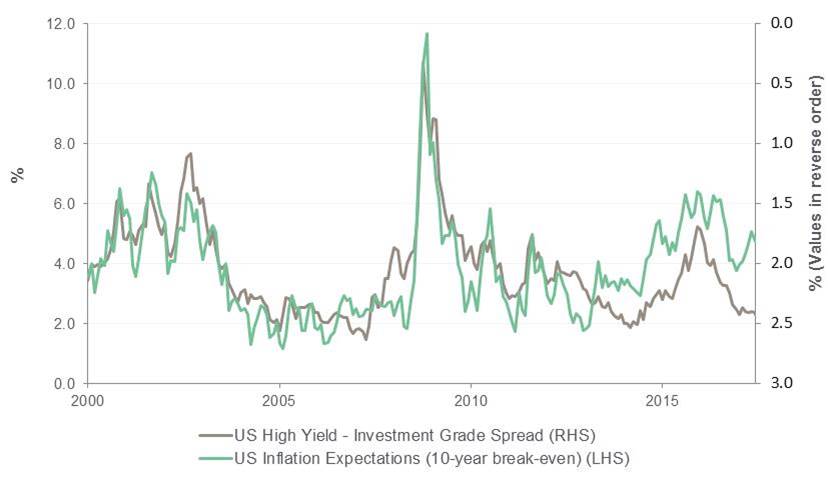
Source: Bloomberg
It is also important to consider that risks can vary considerably within each credit rung of the junk bond category. While many credit investors turn to this area in an attempt to boost yields, there are varying degrees of risks that do not necessarily compensate the investor with a higher return.
“The ability of CCC issuers to service their debt would be severely impeded if rates rose just 1.0%”
For example, in the CCC rating category the extra yield offered on issuers declines considerably as debt increases. On average, a company with three times leverage only offers an extra 10 basis points above a company with two times leverage. Further, the ability of CCC issuers to service their debt would be severely impeded if rates rose just 1.0%, to the extent that the interest payments would need to be funded by issuing further debt.
Structural change leads to risks at sector level
There are also varying vulnerabilities and growing risks at the sector level due to ongoing structural industry changes. These shifts cannot be weathered as easily by the high yield space when compared with their investment grade counterparts, given the former lacks the same financial flexibility. Further, if we are at the late stages of the US economic cycle, the impact of such changes are likely to be amplified by cyclical headwinds.
Delving deeper, while the energy sector faces its own challenges from weaker oil prices, the telecommunications and consumer spaces are looking increasingly concerning. For example, telecommunications are enduring a significant drop in the price of their services. This is evident in the Wireless Services Price Index, which has fallen by 11% in the six months to the end of June. While the reaction has been relatively muted in high yield telecommunications credit so far, the negative impact can be seen much more clearly in equities.
Charts 3 & 4: High yield telecommunications vulnerabilities increase as service prices plunge
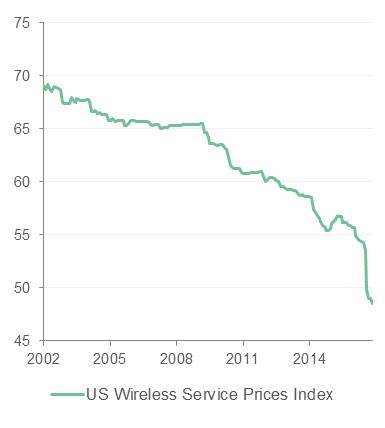
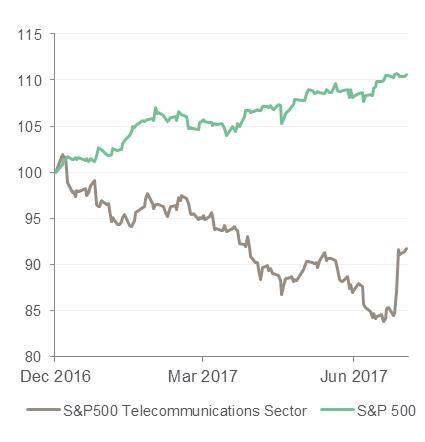
Source: Bloomberg
The consumer-orientated areas are also a worry as supermarkets and food have more recently joined the longer term weakness in broader retail. This follows on the back of the Amazon-Wholefoods acquisition announcement, reflecting the growing threat of disruption from online retailers on more traditional distribution channels.
High yield (junk) bonds to underperform
With these factors in mind, we believe the high yield credit area is much more vulnerable than its investment grade counterpart. As such, we have positioned our alpha portfolios to benefit from the underperformance of junk bonds. This is achieved through buying protection on high yield indices and selling protection on safer investment grade credit. By selling protection on investment grade, the cost of our high yield trade is reduced. In turn, the trade performs well if we see a widening of high yield spreads versus investment grade. We see this as a reasonable probability of occurring in the near term. In turn, this is a relatively defensive approach that aims to protect portfolios, as well as offer a more active alternative that can still deliver returns when more conservative credit outperforms.
Within our yield focused funds we advocate for a more diversified approach to generating regular income by looking beyond credit markets and gain exposure to Australian shares that are generating consistent dividends. The Australian share market has established a remarkably reliable track record of delivering dividend yields of around 4% since 1982 and presents a suitable complement to a portfolio of high grade credit and corporate debt. With this approach investors can mitigate the exposure to risks that are gathering steam in parts of the credit spectrum.
28 August 2017
Changes to BT Sustainable International Share Fund (ARSN: 612 665 219)
Following a recent review of the BT Sustainable International Share Fund (Fund), the sustainable and ethical screening process is changing.
Implementation of additional screens
The Fund will add new screens to its sustainable and ethical screening process, which are to avoid investments in companies with material business involvement in the following activities:
> the production of tobacco or alcohol,
> manufacture or provision of gaming facilities,
> manufacture of weapons or armaments,
> manufacture or distribution of pornography,
> directly mine uranium for the purpose of weapons manufacturing,
> extraction of thermal coal and oil sands production.
BTIM considers that a company has a material business involvement in an activity if 10% or more of its total revenue is derived from that activity. We expect a 10% revenue threshold level to make a meaningful impact on excluding companies from the Fund’s investable universe that are considered to be ‘harmful’ or ‘controversial’ to society whilst allowing the Fund to be managed in line with its investment risk/return objectives.
BTIM believes the additional screens are in line with investors’ present expectation on how sustainable investments are managed and also demonstrate our commitment to a leading approach in responsible investing.
The information memorandum for the Fund has been updated to reflect the change and is available on BTIM website.
28 August 2017
Changes to BT Wholesale Australian Sustainable Share Fund (ARSN: 097 661 857)
Following a recent review of the BT Wholesale Australian Sustainable Share Fund, the fund name and sustainable and ethical screening process is changing.
Change of fund name
The name of the fund will change from BT Wholesale Australian Sustainable Share Fund to BT Sustainable Australian Share Fund (Fund) to align it with other funds in our sustainable range.
Implementation of additional screens
The Fund will add new screens to its sustainable and ethical screening process, which are to avoid investments in companies with material business involvement in the following activities:
> the production of tobacco or alcohol,
> manufacture or provision of gaming facilities,
> manufacture of weapons or armaments,
> manufacture or distribution of pornography,
> directly mine uranium for the purpose of weapons manufacturing,
> extraction of thermal coal and oil sands production.
BTIM considers that a company has a material business involvement in an activity if 10% or more of its total revenue is derived from that activity. We expect a 10% revenue threshold level to make a meaningful impact on excluding companies from the Fund’s investable universe that are considered to be ‘harmful’ or ‘controversial’ to society whilst allowing the Fund to be managed in line with its investment risk/return objectives.
BTIM believes the additional screens are in line with investors’ present expectation on how sustainable investments are managed and also demonstrate our commitment to a leading approach in responsible investing.
The product disclosure statement for the Fund has been updated to reflect the changes and is available on the Pendal website.
Each of the five Wholesale Plus diversified funds invest into an Underlying Fund where the responsible entity is BT Investment Management (Fund Services) Limited and the investment manager is BT Investment Management (Institutional) Limited (collectively ‘BTIM’). Under the terms of its appointment, the Manager selects and manages the assets of each Underlying Fund, may review and amend the investment parameters at its discretion and appoint other managers to manage some or all of each Underlying Fund’s assets.
BTIM regularly reviews the asset allocation neutral positions of the Underlying Funds for the BT Wholesale Plus diversified funds. The asset allocation neutral positions reflect our latest asset class assumptions for return, risk and inter-asset class correlations and position the funds to take advantage of future market conditions. The asset allocation neutral positions are also used to calculate the benchmark return for each fund.
Following a review, BTIM changed the asset allocation neutral positions for the Underlying Funds, effective 24 May 2017. Details of the changes for each Underlying Fund can be found here.
Histrionics – of or belonging to stage players or to play-acting; theatrical; dramatic.
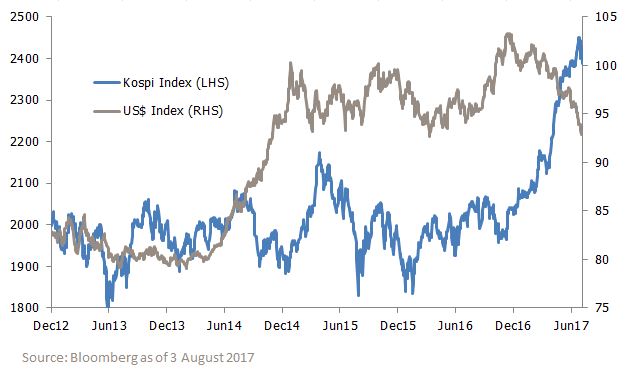
This month during summer break I spent some time on the East Coast of the US. It was surreal listening to family and friends separated by a chasm on their political views. But it was also amusing to be part of the conversation fed by the daily drama emerging from the White House. More so as for the first time Americans wanted to know what Asia in general thought about President Trump and his administration. Fortunately, we’ve had our fair share of colourful leaders in Asia. Over the years, experience has inured us to recognise that political developments can make a difference to broad market movements. What is of more relevance, though, is the trend of the US dollar, which still remains the reserve currency. Look no further than the South Korean market this year. A belligerent North Korea, an impeached and deposed President, management of its largest conglomerate, Samsung Electronics, accused of involvement in money politics, and China threatening retaliation for siding with the US, who would have expected South Korea to be amongst the best-performing markets in the region over the year to date?
Korean stocks boom as the US dollar swoons
More in Malaysia
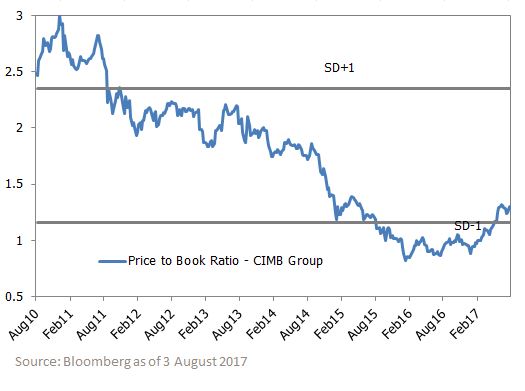
Our exposure to Malaysian stocks has risen to 5%, from a zero weighting at the start of the year. Generally speaking, analysts and commentators alike rarely have much to say that is complimentary on the way the Malaysian economy is managed. I, too, am sympathetic to that viewpoint. However, when deterioration in economic conditions has been reflected in market prices, both in equities and the currency, it does make sense, in my view, to take a positive view. There is no other justification except to say that a lot of the negativity is in the price, and I don’t think we will lose too much on our Malaysian investments. But the probability that things can go right is, I believe, high and time will tell how well that scenario develops.
Malaysian bank CIMB Group looks cheap on a price-to-book value basis
“The Reserve Bank of India has asked banks to initiate bankruptcy proceedings against 12 large loan defaulters, accounting for a quarter of nearly INR 9trn that the banking system has piled up in bad loans.”
Hindustan Times, 7 August 2017
Our top-down process looks at a broad range of top-down drivers of emerging equity markets. One market that we have been positive on for several years has been India, with a preference there for domestic cyclical stocks. Both of those views have contributed positively to the performance of the portfolio. Since September 2013, the MSCI India index has delivered a total return of 56.6%, in US dollar terms, well above the MSCI Emerging Markets Index total return of 20.0%. That is not to say, however, that all of the drivers have played out as we expected. In particular, we have been revisiting our positive view on the banking and credit cycle in India.
We had expected an upswing in the credit cycle, which would be supportive of economic growth, both through consumption and investment. Inflation has come in substantially below expectations and both private sector credit/GDP and the loan/deposit ratio of the banking system have declined in recent years, in contrast to the ramp-ups of credit seen in some other emerging markets. Yet despite the apparent opportunity, growth has not come through. In the year to Q1 2017, we estimate system loan growth at 6.2%, compared to a 10.2% increase in nominal GDP. This is both negative for banking sector stocks and also for other cyclical stocks in India. Where were we wrong?

Looking into the reports from the banks, it is clear there is a three-tier structure to growth in the Indian banking system. We have focused on the year to Q1 2017, but where Q2 2017 results are available, the pattern is the same.
The good news is in retail credit, particularly consumer and mortgage finance. Overall, we see loan growth of specialist mortgage lenders at 18.3% and that of consumer finance institutions at 16.9%. This pattern is mirrored within the loan books of more diversified private sector banks. Private sector banks did well (loans +14.7%) but were generally held back by weaker growth in corporate lending departments. In the portfolio we own HDFC Bank (loan growth +19.4%, led by retail), ICICI Bank (retail loans +18.5%, corporate +5.8%), Axis Bank (retail loans +21.0%, led by home loans; corporate loans flat) and Yes Bank (loans +34.7%, with the retail business growing 140%).1
With the very strong consumer and mortgage growth and the moderate growth in corporate loans from private sector banks, it is the state-owned (PSU) banks where the real disappointment comes in. PSU banks saw loans grow just 2.5%, with heavyweight State Bank of India at 7.3% and weaker growth elsewhere.1 It is particularly in the PSU banks where the much-reported non-performing asset (NPA) problem sits. The clean-up is positive for India in the long run, but the write-off of NPAs eats into both loan growth and capital of the banks, and has been a drag in the short term. We continue to be believers in the Modi administration’s reform process, but see the PSU banks being a problem for some years yet.
In this three-tier structure the private sector banks (including those we hold) have been able to do well, particularly from the retail sector, and this has benefited the portfolio. However, we have not yet seen the broad increase in lending that would lift overall growth in the Indian economy. We continue to see opportunities in the banking system, but recognise that a broad credit recovery may still be some way off.
1 Source: Bloomberg/JOHCM as at August 2017.
In our recent research trip members of our BTIM Concentrated Global Shares Team met with a range of CEOs, CFOs, operational heads and investor relations contacts at companies across multiple cities in the US (Seattle, Chicago, Boston and New York) and Europe (London, Paris and Berlin). On this trip we focused primarily on our industrial businesses based in the US and the global consumer beverage, restaurant and media names based in Europe. While our primary interest was on specific operational updates from our investee companies, we also widened the lens on Europe to gauge how the broader economy is progressing along some semblance of recovery and how that may evolve over time. Data observations on the European economy in recent months have been painting a picture of iterative improvement in consumer and business conditions so it is prudent to delve deeper at this point in time.
“Investors will be well rewarded by taking a genuine long-term approach to allocating capital to European equities”
Our broad range of meetings (sample list below) reaffirmed our positive view that the world’s economies are on the mend and the major European domestic economies are well positioned to see growth in manufacturing, further reductions in unemployment, rising asset prices and favourable conditions for businesses linked to the domestic economy. We believe investors will be well rewarded by taking a genuine long-term approach to allocating capital to European equities. Currently, our Concentrated Global Equity Fund has over 28% invested in European and UK equity positions.
Companies visited – June 2017
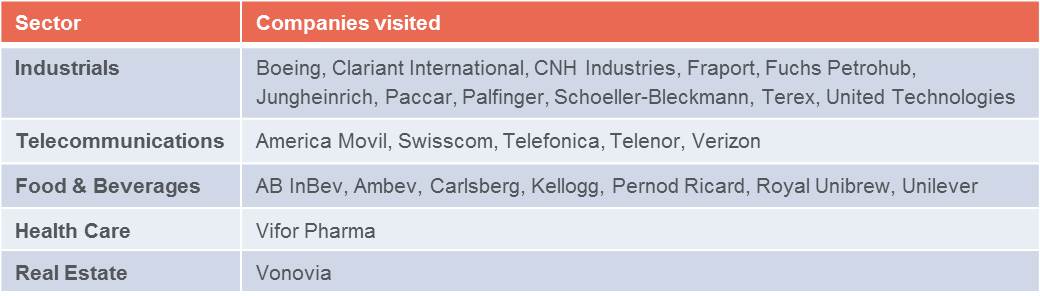
In overall terms, our meetings with industrial companies confirmed our positive views on their respective industries. Regular readers of our monthly and quarterly commentaries would be well aware of our positive views and associated meaningful positions in the aerospace industry so we are taking the opportunity through this article to provide an update from our visit to Boeing’s headquarters. Boeing is one such aerospace business held within our Fund.
______________________________________________________________________________________________________________________________________
![]()
Operational update
The key objective of our research agenda for Boeing was to gain a deeper understanding of the underlying demand dynamics that support aircraft production. We also sought to understand and assess management’s strategy to return free cash flow – the net revenue generated from ongoing operations – to shareholders.
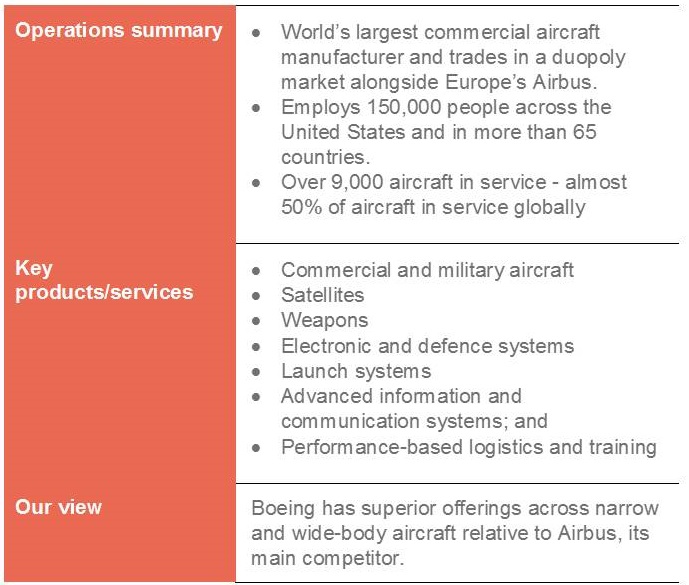
Following these discussions, our assessment of Boeing’s prospects remains positive. The company has successfully managed earlier technical issues with the Dreamliner 787, which has allowed management to focus on improving the program’s economics. Cash-based breakeven was achieved in the second quarter of 2016 and profitability has improved in each subsequent quarter through cost reductions and the sale of more profitable variants of the 787.
At the same time, production of new aircraft continues to accelerate. Factoring in the company’s strong order pipeline, the cash flow and earnings power of Boeing is well supported over the coming years. We don’t expect the development of the next generation of aircraft to disrupt Boeing’s cash flow growth as expenditure for the new 737MAX-10 and ‘middle of the market’ aircraft will coincide with the completion of existing program investments. If approved for development, the ‘middle of the market’ aircraft could deliver Boeing a significant gain in market share. This new offering is designed to fill the market gap that exists between the 737 and the 787, which at the very least, would improve the economics for routes where the 787 is perhaps not best suited. The more significant opportunity for this aircraft is to introduce new routes for airlines, which will drive incremental demand for new aircraft. Our feedback from aviation industry observers suggests the market for such an aircraft would be around 4,000 units.
Industry outlook
Lower real travel costs, thanks to lower fuel costs, more routes, strong economic fundamentals in the US and signs of recovery in Europe, bode well for growth in airline traffic. The International Air Transport Association (IATA) recently upgraded their forecast passenger growth for 2017 to 7.2%, significantly higher than the longer term average of 5%.1
Performance relative to competitors
This year’s Paris Air Show, the world’s premier exhibition for the aerospace industry and a key forum for attracting aircraft orders, provided a good opportunity to corroborate the strong demand Boeing is seeing from airlines. Boeing outsold Airbus at the show, with 571 firm orders and commitments for new aircraft, compared with 336 recorded by Airbus. At list price, the Boeing orders could potentially gross US$75 billion in revenue.

New aircraft on exhibition at Paris Air Show. Source: parisairshow.tv
Conviction in management
Boeing’s Chairman, President and CEO, Dennis Muilenburg, is a highly regarded operator and knows the business intimately. Muilenburg’s tenure with the company dates back to 1985 and he was appointed as CEO in July 2015, with subsequent appointment as Chairman of the Board in March 2016. . Muilenburg and the Board have maintained a commitment to delivering shareholder value, with a stated goal of returning a majority of the company’s free cash flow to shareholders. Since taking the helm, this commitment has seen the company deliver strong dividends and maintain commendable discipline in capital expenditure – credentials that look for within our process.
Conclusion
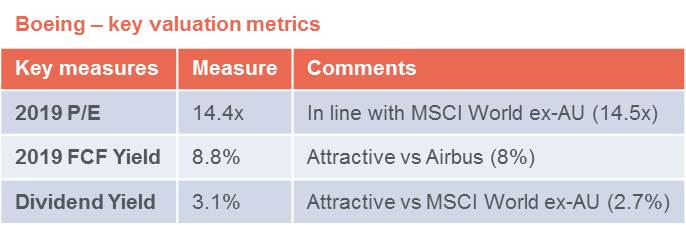
Our continuing discussions with company representatives give us confidence that the new management team are focused on assigning more operating authority to their unit heads which, over time, should encourage more entrepreneurial ownership behaviour. This will result in lower capital expenditure, lower research and development costs and higher production efficiencies being extracted. Management remains committed to delivering 100% of the free cash flow to shareholders and we are happy to continue to hold this business in our portfolio for the foreseeable future, especially considering the business is trading on an adjusted free cash flow yield of 9%, compared with 8% for Airbus.
1. Source: World Bank
______________________________________________________________________________________________________________________________________________________________________
The Bots have landed…at a pharmacy?
We have all heard stories of robots taking human jobs, be it in the automobile manufacturing industry, transportation, asset management and financial advice service areas, and there is no doubt the trend is accelerating. 
There was no better example of this acceleration than a recent site visit to a high street retail pharmacy in downtown Berlin, where robots were dispensing prescribed medicines directly to the consumer. All that is required is your doctor’s script which is entered by the sales clerk into the cashier terminal and within one minute your product is dispensed, complete with labelled instructions on dosage. The system is fast and efficient, providing an end-to-end inventory and billing management process to facilitate increased compliance. With one less head count in the store and no need to accommodate a lunch break, the productivity gains are significant.
It will be interesting to see how long this technology takes to arrive in Australia and the reaction from the Pharmacy Guild of Australia. We can see early interest from the discount pharmacy chains, given their model is geared towards high turnover / lower margin.
Naturally, this system would require some change in practice for doctors, many of which still issue hand written scripts with scribe quality that is often at odds with their level of intelligence. Of course, machine learning may come into play here and the bots will no doubt progressively learn to decipher the most illegible doctors’ scrawl.
We monitor disruptive developments like these emanating from offshore markets to consider the implications for investors. Not only will pharma-bots be a win for consumers, the major pharmaceuticals manufacturers will naturally hold a vested interest in the more efficient delivery of their product to consumers. It is plausible to see companies like Merck, Sanofi and Pfizer pursue a direct distribution model and develop ATM-style dispensaries installed at convenient sites like your local café. A skim latte, blueberry friand and 250mg of Penicillin please!