31 October 2017
Pendal Balanced Equity Income Fund (APIR: BTA0428AU, ARSN: 159 947 270) – Important information
Reduction in management costs from 1 November 2017
With effect from 1 November 2017, the Fund’s management costs will reduce.
The management costs are currently made up of an issuer fee of 1.39% pa and an expense recovery of 0.15% pa. The issuer fee will reduce to 0.88% pa and the Fund will no longer charge expense recoveries.
Changes to the Fund’s investment strategy from 1 December 2017
Following a recent review, we will be changing the Fund’s investment strategy with the aim of enhancing the Fund’s ability to perform in a range of different market conditions.
The Fund invests primarily in an actively managed portfolio of shares in the S&P/ASX 200 Index and uses options and other derivatives to generate income and reduce market risk. The Fund’s portfolio is constructed using four key steps.
From 1 December 2017, the Fund’s portfolio construction process will comprise the following steps:
1. Investing in a selection of shares in the S&P/ASX 200 to generate income from dividends. The portfolio will generally include 20-60 companies, with a bias towards high dividend yielding stocks with franking credits based on our positive, fundamental company analysis. Pendal’s fundamental company analysis focuses on four key factors: valuation, franchise, management quality and risk factors (both financial and non-financial risk);
2. Selling call options over some or all of the shares in the portfolio and/or the S&P/ASX200 Index to generate certain income from option premiums in exchange for forgoing a significant component of the potential gains on the share portfolio. Any share call options sold will be fully backed by holding the shares in the portfolio;
3. Buying put options over the S&P/ASX 200 Index and specific shares held in the portfolio with the aim of significantly reducing the Fund’s downside market exposure; and
4. A hedging strategy may also be applied to reduce the adverse impact of extreme market movements caused by significant global events that are expected to occur infrequently. The strategy uses derivatives over international share indices and volatility indices that generate profit when share markets experience large negative movements. This is based on our fundamental view that movements in share markets globally are closely correlated when significant global events occur.
How is this different to the current portfolio construction process?
The new portfolio construction process enables the portfolio to generate income from option premiums, by selling call options over some or all of the shares in the portfolio as well as the S&P/ASX 200 Index, instead of selling call options over all the shares held in the portfolio. This change allows the portfolio greater flexibility to tailor exposure to where BTIM believes the best risk/reward benefits lie. For example, where BTIM’s analysis indicates the medium to long term outlook of the share outweighs the premium that would be received from selling the call option, the portfolio would have the ability not to sell the call option over the share.
The portfolio construction process will now also include buying put options over specific shares held in the portfolio, in addition to the current portfolio construction process of buying put options over the S&P/ASX 200 Index. The current process of buying put options over the S&P/ASX 200 Index protects the Fund against broad downside market exposure, but not all sectors and stocks perform in line with the index. The ability to buy put options over specific shares is expected to better protect the portfolio from sector and stock specific downside exposure.
The Fund will continue to invest in a selection of shares in the S&P/ASX 200 Index and generally hold 20-60 companies with a bias towards high dividend yielding stocks with franking credits. As the Fund can now sell options over the shares in the portfolio and/or S&P/ASX 200 Index, this reduces any potential bias in the portfolio towards shares whose options are more liquid.
The overall exposure limits of the strategy are not affected and we do not expect any material change to the Fund’s risk return profile. Furthermore, there is no change to the Fund’s investment return objective.
An update on the Techs and the real story inside Intel’s secret chip society
In our recent research trip we met with a range of CEOs, CFOs, operational heads and investor relations contacts at companies in London and across multiple cities in the US (San Francisco, Santa Clara, Las Vegas). On this trip we focused primarily on our technology-related businesses based in the US, leisure resorts, global pharmaceutical, European financials and small to medium cap companies listed on the London Stock Exchange. While our primary interest was on specific operational updates from our investee companies, we also widened the lens to see how the small to medium end businesses were coping with the fallout from Brexit and uncertainty in the UK and European economies.
“the world is on the mend and the Technology industry is well positioned to benefit”
Ashley Pittard, Head of Global Equities
In an overall sense, our broad range of meetings (sample list below) continue to reaffirm our belief that the world is on the mend and the Technology industry is well positioned to benefit. We believe investors will be well rewarded by taking a genuine long term approach to allocating capital to the Technology sector and the Pendal Concentrated Global Equity Fund has over 20% invested in such positions.
Company meetings – September 2017

We currently own names in software, analogue circuits, semiconductor producers and associated equipment manufacturing businesses in our portfolio. Regular readers of our fund commentaries would be well aware of our views on technology so in this edition we provide a deeper insight into Intel, one such semiconductor business we hold today.
____________________________________________________________________________________________________________
Intel Corporation – chipping away at a much bigger prize 
In a nondescript building in Santa Clara which belies its place in history sits the global headquarters of Intel, the world’s largest semiconductor company. Intel is credited with developing the world’s first ever microprocessor chip in 1971. This microprocessor went on to become the building block that engineers could purchase and then customise with software to perform different functions in a wide variety of electric devices. The microprocessor is the central processing unit (CPU), or the ‘brain’ of a computer. In 1971 this microprocessor the size of a thumbnail was considered revolutionary in that it delivered the same computing power of the first computer built in 1946, which filled an entire room. Since then, Intel has been instrumental in developing increasingly more powerful microprocessors without increasing the size of the chip. Today, microprocessor chips power data centres, PCs, smartphones and a myriad of other electronic devices that we use in our daily lives. Microprocessors are now being designed for a wide range of specific applications.
Chips simply roll off the production line, right?
Designing and manufacturing the ‘brain’ of the computer is actually an intricate, time consuming and expensive task and becoming increasingly so. Consumer demand for automated driving, connected home devices, robotics and virtual reality capabilities among other things require significantly more chip ‘brain’ power. While they appear to be flat, chips are actually three-dimensional structures and may include as many of 30 layers of complex circuitry. The design and manufacture of a chip can typically take around five years. Clearly, the business of producing microprocessors is anything but simple.
“It takes longer to assemble a microprocessor than it does a Boeing aircraft”
Sue Scott, Senior Investment Analyst
Chips are made by creating tiny patterns on a polished 12 inch silicon disk (wafer) using a process called photolithography and depositing very fine layers of material on top. The wafer itself is a thin slice of semiconductor material (silicon). The most sophisticated processor can contain millions (or billions) of transistors interconnected by fine wires made of copper. Each of these transistors act like neurons in the brain controlling the flow of electricity through the chip to send, receive and process information. After typically more than 2000 steps of lithography, etching and material application, the wafers are transformed into microprocessors. Each is then cut into many thumbnail sized ‘dies’, which are individually placed in a ceramic enclosure. The ceramic package protects the die and delivers power and electrical connections when placed directly into a computer circuit board or mobile device. By comparison, it takes longer to assemble a microprocessor than it does a Boeing aircraft!
Check out the following video to see how chips are produced
In 1971 the revolutionary Intel microprocessor held 2300 transistors; today there are over 7.2 billion transistors in Intel’s Broadwell-EP Xeon microprocessor. The circuit line width in the original model was 10,000 nanometres (one billionth of a metre); today Intel are manufacturing 14 nanometre microprocessors, implying significantly more ‘brain power’. To put this in context, an average human hair is 100,000 nanometres wide.
The scale and complexity of chip design requires specialised, tightly controlled manufacturing processes. And Intel is one of the few semiconductor companies who manufacture their own product rather than outsourcing the production to a foundry.

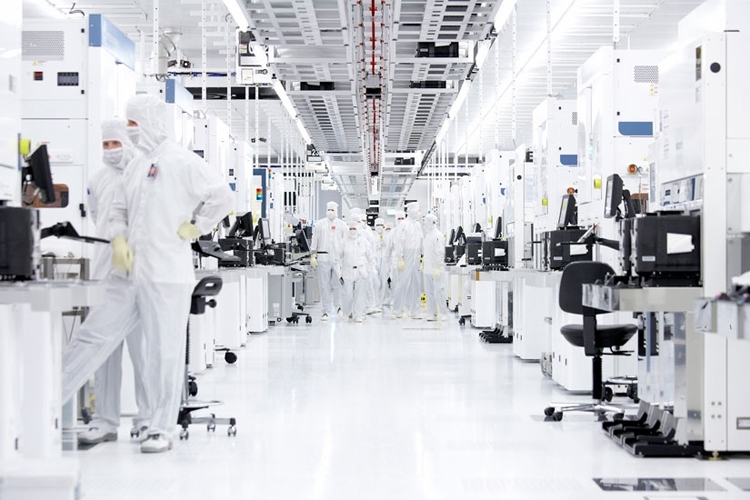
The microprocessor chips are manufactured in a factory, or what is referred to in the industry as a ‘fab’. The Intel manufacturing fabs in the US, China, Ireland and Israel are a far cry from what one may imagine a factory floor to look like. The fabs themselves cost over US$8.5 billion to build and are state of the art facilities fitted out with machinery worth in the hundreds of millions. Before entering one of these fabs, often referred to as a clean room, technicians need to have cleaned their hands and face as make-up, perfume and other cosmetics are forbidden. They are then required to don what has been called a bunny suit to enter a pressurised room that sits between the outside world and the clean room. The suit covers the whole body and includes gloves, safety glasses and a mouthguard. The air in the clean room is what is called Class 10 purity, which means for every cubic foot of air there can be no more than 10 particles larger than half a micron, which is about the size of small bacteria. To put that in context, in a hospital operating room there can be as many as 10,000 bacteria size particles in a cubic foot of air, and in the outside world there are about 3 million. Manufacturing their own products provides Intel with the ability to optimise performance, reduce operating costs, shorten time to market, and enable them to scale new products quickly – a distinct advantage over competitors in the industry.
Examining the investment case
Considering the vast intricacies and associated manufacturing costs for chip makers, can investors achieve a decent return from Intel? Our response is an emphatic “yes”. In 2016 the worldwide semiconductor market reached a record value of $334 billion. According to Gartner, an independent technology industry research firm, the industry is continuing to grow at a double-digit rate in 2017. This view was certainly reinforced by the semiconductor companies we met on our most recent research trip.
Intel holds the number one share in the semiconductor market, a position it has held since 1992. Intel reported full year revenues for the last fiscal year of a record US$60 billion with gross margins above 60%. However, despite the impressive metrics and the strong underlying industry fundamentals, Intel’s share price has lagged the Philadelphia Stock Exchange Semiconductor Index (up by over 30% for the calendar year to date). More recently, Intel’s shares were trading on a 2018 price to earnings ratio of around 13x which is a discount of approximately 20% to the S&P500 market multiple.
Why the underperformance?
About 55% of Intel’s microprocessor revenues are PC related, where Intel commands a market share of over 80%. In 2016 global PC sales fell for the fifth consecutive year and continue to see declines in 2017 as consumers move to mobile devices such as laptops and smart-phones. The consensus view is that Intel are not only vulnerable to falling revenues in their PC division, but also margin declines as new competitors look to take market share. Interestingly however, despite declines in global PC sales, Intel managed to grow their PC-related revenues in 2016 by around 2% and sales continue to outpace broader market declines this year.
Responding to the revenue challenge
Intel’s management are realists and they expect global PC sales to continue to crimp growth. Strategically they have identified ‘the cloud’ as the most important trend in shaping the future of technology. According to Intel, the cloud will enable a change in the relationship individuals have with technology, as appliances and devices become increasingly connected to each other. Product development is now increasingly focused on the strategic goal of transforming the business into one which is less reliant on growth from PC-related revenues and more leveraged to growth from the cloud. The significant amounts of computing power required for this industry transformation play to Intel’s strength.
Technology innovation is embedded in the company’s DNA, as is the ethos echoed by former CEO, Andy Grove, that “only the paranoid survive”. Being the leader in revolutionary technology is the objective, hence the relatively high 20% of sales revenue spent on research and development. Growth in the data centre division, which best reflects their cloud strategy, has been in the high single digits in the last two years and accounted for around 30% of revenues in 2016.
2017 has seen a myriad of new product launches, primarily targeted at cloud customers. These new product launches along with the product pipeline are positioning Intel to be a leading supplier of chips not only in PCs, but extending to cloud applications, automotive and 5G communication industries.
“Start with a growing market. Swim in a stream that becomes a river and ultimately an ocean. Be a leader in that market, not a follower, and constantly build the best products possible.”
Robert Noyce, Intel’s co-founder and co-inventor of the integrated circuit
The market has been justifiably concerned about declines in PC business and a share price that is little changed in three years. In our view, Intel have done well to maintain PC revenues and margins amid the declining market and have concurrently been transforming the company from being PC-centric to a data-centric powerhouse. As shareholders, we understand this sort of transformation takes time and investment, and we do not think current share prices give credit to a company that is maintaining a meaningful PC business in challenging conditions, whilst at the same time positioning the broader business for long term growth. While this transformation progresses, we have seen the opportunity to buy the market leader in semiconductors at an attractive valuation with a thesis that is supported by evolving revenue sources. Considered together with a solid 3% dividend double the rate of its sector peers we are being paid to wait for the new revenue streams currently sitting deep within the sanctity of the fabs.

Inflation for the September quarter came in marginally lower than expected at 0.6% headline and 0.4% underlying. This leaves annual headline at 1.8% and underlying at 1.9%.
Whilst the headlines were grabbed by the expected sharp increase in Electricity prices (+8.9%) and sharp decline in Vegetables (-10.9%) these are trimmed away in the underlying numbers, where the RBA focuses. Food, beverages and tobacco make up 24% of CPI so the majority of trimming is found in the sub items in these groups, both to the upside and downside. Throw in automotive fuel (3.55% weight) and the other “energy” called utilities (3.6%) and you are at the 30% mark, so we generally end up with the trimmed mean being effectively like the US underlying called “ex food and energy”.
Where could the RBA take some encouragement?
The main area the RBA would take some encouragement is in the performance of non-tradables.
Seasonally adjusted non-tradable inflation was the highest since Q3 2013 at 0.86%. The lower inflation number was again due to tradable deflation being at its lowest since Dec 2014 at -0.78%. In fact tradable inflation has been flat net on net since March 2014. In the same period non-tradable is up 8.7%. The RBA only really influences non-tradable inflation and is a price taker of tradables. Therefore, if there were to be some global inflation generated by the pick-up in global growth this year, it would feed through to Australia’s inflation outlook.
Chart 1: Tradables inflation continues to lag its non-tradables counterpart
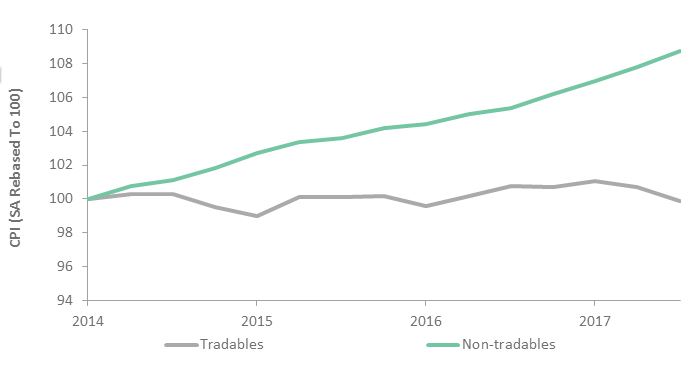
Source: ABS
The second area of encouragement is housing. Of the 70% of CPI which generally makes up underlying inflation, housing dominates. Rents (6.7%), New Dwelling Purchases (8.67%) and Maintenance and Repair (2%) are 17.3% of overall CPI, but therefore usually 25% of underlying. So any big theme in housing should drive underlying inflation. In this regard there are a few early but encouraging signs. New dwelling purchases were up 0.8% q/q and 3.1% y/y, showing ongoing high housing construction numbers are having an impact. Rents remains subdued overall, but vary across major cities. Increases are relatively strong in Sydney, healthy in Melbourne but turning negative in Brisbane as the much talked about oversupply bites. Perth should see some recovery from recent declines. Continuing strong immigration numbers should see rents hold up in general.
Delving deeper into the capital cities, the major drag on inflation has been from Perth and Darwin (less than 1% CPI annually). Brisbane has begun to recover and given recent employment data there are hopes Perth and Darwin may follow. Adelaide and Hobart have largely caught up with Sydney and Melbourne (at around 2%), which highlights reason for hope. Although not a major change, the recovery of the mining states could see inflation settling back in the lower end of the 2-3% band.
What would discourage the RBA?
The breadth of low inflation is the main area of concern. The ANZ Diffusion Index showed only 26% of items had a quarterly annualised price increase of 2.5% or more. The main culprits were again retail-led, with a majority of items experiencing falling prices. The AUD was stronger across the majority of the quarter and is currently weakening but recent experience has shown little currency impact on goods prices. Much has been written about structural changes in retail and the evidence suggests it will continue to weigh on inflation for a number of years yet.
Where does this leave the RBA?
The RBA will remain on a watching brief into 2018. The wage data on 15 November will be the next piece of information and given the minimum wage increase of 3.2% hits the Q3 numbers, it should show an uptick. Whether this feeds into inflation immediately is doubtful, but it would help the narrative of a slow but gradual pick up in prices, which took a hit with the CPI numbers. As there is no January RBA meeting they will have the Q4 CPI numbers (due out 25 January) by their first 2018 meeting and for their February bi-annual Parliamentary Economics Committee Update. They will likely want to open the New Year on a positive note, but the Q4 CPI numbers will hold the key as to whether that positive note may include firmer hints of tighter monetary policy into 2018. With other central banks easing back from monetary stimulus, the RBA would be hoping to follow suit at some point in 2018. We will be watching closely for clues as to when that might be.
“KOSPI-listed Firms’ Dividend Surpasses 3 Trillion Won in First Half”
Business Korea, 4 October 2017.

Seoul, South Korea at dusk
We have been overweight Korean equities since the end of 2012, finding the combination of strong corporate growth, attractive valuations and corporate governance reform an attractive proposition. The portfolio has benefited from this position, both through a modest positive performance contribution from the country allocation, and a very substantial contribution from stock selection in Korea.
Our view has been focused on Korean exporters (that also meet our valuation and corporate governance requirements), but that view is changing. At the end of 2016 Korea saw a major corruption scandal that led to mass protests, the impeachment of then President Park Geun-hye and an election in May 2017. That election returned a more liberal/left-wing administration under President Moon Jae-in, and is a significant contributor to our widened area of opportunity in the Korean equity market.
The stand-out feature of Korean equities is how cheap they are. On an industry-neutral basis, the cheapest markets (on a price/earnings basis) in the emerging world are Russia, Greece, Pakistan and Korea. Three of those face serious economic and/or political challenges; Korea does not. Korean equities are cheap because those earnings do not translate into dividends. Corporate Korea has the lowest payout ratio of any major market in the world, because a lack of effective oversight allows company managers to simply hold cash back from shareholders.
The cheapest markets in the emerging world are Russia, Greece, Pakistan and Korea. Three of those face serious economic and/or political challenges; Korea does not.
To put some numbers on this, in 2016 the non-financial companies in MSCI Korea paid out KRW 15.7trn (USD 13.5bn at 2016 exchange rate) in dividends on an earnings base of KRW 71.5trn, a 22% pay-out ratio. Those dividends look even less generous when one considers that those companies generated KRW 143.2trn in cash-flow from operations and had a capital expenditure of KRW 95.6trn. The resultant KRW 47.6trn in free cashflow is potentially entirely available to pay out as dividends, which would increase the dividend yield on non-financial MSCI Korea from the current 1.4% to 5.0%. Five-year government bond yields in Korea are 2.0% for comparison.
Incredibly, there can and should be more. The net debt/equity of these companies is 10%, making Korea one of the least-levered markets in the world. The emerging market average for non-financial companies is 27.8%, implying that a further KRW 167.6trn of dividends (representing 17.8% of market capitalisation) could also be paid out through more efficient capital management.
The behaviour of corporate Korea and the related lack of dividends has become an increasing issue in Korean politics, as an ageing population needs income from its investments. We feel that both the Korean public’s response to the corruption scandal, and the resulting election of a left-wing administration, will put huge pressure on Korean companies to reform, and that this will be the catalyst to unlock much of the hidden value in the Korean equity market.
Crucially, though, and in line with our investment process, we feel this creates opportunities within Korea rather than making a case to own every stock in the market. Firstly, financial companies have been excluded from this calculation as this is not a useful analysis. Secondly, Korea does contain a few horribly over-leveraged businesses (Korean Air Lines, for example, has a debt/equity ratio of 780% and net debt/ equity of 5.1x). As always in emerging markets, it pays to be selective.
Volatility leads high yield spreads lower

We have been living in a low-volatility world for a while now, driven by a massive alphabet soup of central bank liquidity which has been delivered globally. If it’s not the Fed engaging in QE’s 1, 2 and 3, it’s the ECB’s PSPP and CSPP bid, BoJ’s QE and yield curve control, or simply the massive stimulus delivered by the PBoC. But the persistence of low volatility and low yields is also thanks to what seems like a Goldilocks global growth picture. The US economy has put in a sufficient recovery over the last year such as to allow the Fed to have hiked three times without much ado from the markets. Similarly, European growth hasn’t been that stellar since the Eurozone sovereign crisis, which put most of the continent into a coma for the last five years. And of course, against all devaluation expectations, the Chinese Yuan and economy have both charted a firm and steady course so far this year.
Put it all together, and you have a global economy probably past its peak but not yet falling over, and activity levels that are holding up but not so strong as to warrant a sharp rise in interest rates. But what lies beneath may not be so Goldilocks. The economy is both ‘too hot’ (US labour market) and ‘too cold’ (global inflation), and it is precisely such opposing forces that currently result in a benign macro backdrop. In the tug-of-war between a Fed determined to pursue monetary normalisation and a stubbornly weak (or at least weaker than-expected) inflation picture, the yield curve has flattened and low-flation has won. Certainly after five disappointing US inflation prints, a belief has set in that we are now in a structurally lower inflation world, perhaps as a result of the success of inflation-targeting central banks.
It was only 18 months ago when the world was convinced that the US was headed into recession. By the start of 2016, WTI crude oil had found new lows in the mid-$20s, US GDP growth had more than halved in less than a year, and ISM PMIs were firmly in contractionary territory. Between mid-2015 and early 2016, US high yield credit spreads had almost doubled to 6 per cent. Concerns over the US being ‘late-cycle’ had quickly escalated into fears of the next US recession, and no investor wanted to touch US retail with a ten-foot barge pole.
Then, in what felt almost like an overnight move, things started to improve. We all know very well by now that the Chinese credit stimulus of late 2015 ‘made America great’ by delivering the impulse needed to avoid the next dip. Soft and hard data based as commodity prices lifted off their lows, and however late-cycle the US might have been then, the economy had once again peered over the edge but stepped back from the abyss. Asset volatility, risk premia, and credit spreads globally followed the US recovery, and the rest is history.
Rikisi – Japanese – literally means ‘strong man’; a general term used for sumo wrestlers
Japan has several attractions, too many to enumerate, that I admire. Japanese food is near the top of that list. My first experience of eating sashimi and sushi was in 1995, thanks to an indulgent American boss. On my first ever road-show to New York, he treated me at an upscale sushi restaurant. I was born to a vegetarian family, possessed a limited palate and was uneducated about the subtleties of cuisine. I was flummoxed when he told me sashimi was raw fish. Boy was I glad I went. Since then, like many of you I presume, I have sampled and savoured great Japanese cuisine served across the world.
Yet, to travel to Japan and partake in its culinary expertise is unique. Dyan Machan, writing in last week’s Wall Street Journal on her travels to Fukuoka, started by saying “it feels silly to apply the term ‘life affirming’ to a bowl of noodles” when she extolled the virtues of a pork-based ramen called tonkotsu. I, too, was fortunate to travel recently to Tokyo and relished more than a couple of great meals. I won’t even try describing the experience – it’s best enjoyed in person.
Japanese cuisine – the epitome of change
Which is why I was perplexed when I read reviews of a book by Bee Wilson, a British food journalist, ‘First Bite: How We Learn to Eat’. She discusses different countries’ food cultures and cites various experts who claim that eating is a learned behaviour. In her telling, she showcases Japan as a country whose cuisine epitomises the psychology of change. “The country’s cuisine hasn’t always been fresh fish, flavourful soups and elegant, umami-loaded offerings that look pretty in bento boxes. For centuries the diet was unrefined and carb-heavy — a typical meal consisted of grains with shredded yam leaves, radishes and pickles. After World War II, though, when the country experienced an economic boom, newfound affluence allowed for more refrigerators (therefore more protein) and more variety. Gradually, as borders opened and palates expanded, the Japanese were introduced to the idea of eating for pleasure, and Japanese cuisine as we now know it was formed. It turns out that wherever they are from, people are capable of altering not just what they eat, but also what they want to eat, and their behaviour when eating it. It is startling that Japan, a country whose “flavour principles” included little spice except ginger, should fall in love with katsu curry sauce made with cumin, garlic and chili. A country where people once ate meals in silence has shifted to one where food is obsessively discussed and noodles are loudly slurped to increase the enjoyment. So perhaps the real question should be: if the Japanese can change, why can’t we?”
The heavier you are, the more force required…
In between my meals I managed to catch the first day of a sumo wrestling competition. For the uninitiated like me, sumo is somewhat equivalent to wrestling. But it is rich in history and tradition where wrestlers adhere to a strict lifestyle. It is fascinating to watch these generously built men, bursting at the seams of their mawashi (a loin-like, thick belt about 30 feet in length that is wrapped around the body several times and knotted securely in the back). A contest starts with the ritual of sprinkling salt, sizing up your opponent, some vigorous stretching before going to battle. A couple of starts reminded me of two big horned rams taking on each other for territorial dominance.
While almost everyone in Japan is trim and lean (some studies say the level of obesity in Japan is just 3.6%), isn’t it ironic that the Sumo wrestlers are encouraged to put on weight? They begin their day with a hard practise and do not usually eat breakfast. Lunch is a meal of nutritious, high-calorie stew with large portions of rice and many side dishes. Sumo wrestlers eat huge amounts of food and nap immediately following a meal in order to gain weight. After I saw the games and these imposing men I understood that the nature of the game necessitated these wrestlers to bulk up. After all, Newton’s second law of motion, acceleration = force/mass, means the heavier you are, the more force an opponent needs to get you moving and push you out of the ring.
HSBC: added heft
You might wonder why do I meander from exquisite cuisine to psychology of food to weight gain amongst sumo wrestlers to Newton’s laws and lead you to a couple of paras finishing up with HSBC Holdings (HSBC), the latest addition to our portfolio. It’s quite simple – HSBC now appears to be a bulked up sumo wrestler. Not fattened up in the traditional sense on costs; au contraire, it has shed its flab in the right places by cutting costs aggressively. Where it has added heft is in its capital position. Simply stated, it is over-capitalised.

Generally speaking, laws address the last crisis, never ones that will occur in future. Since 2008, the banking industry has seen tighter regulation and is in much better financial shape today. Chastened by near death experiences and a severe fall in revenues (as interest rates globally have fallen), banks had to cut costs aggressively, pare lending and conserve capital. Two ‘extraordinary’ costs – provisioning for non-performing loans and regulatory fines have, in my view, peaked. Over the next few years, technology will likely be a double-edged sword. Applications like blockchain will help lower the cost curve while start-ups try to disrupt payments and other financial products. No one can predict for sure what the net impact will be. However, from an operational standpoint, HSBC, after cutting costs, is positioned for positive operating leverage. The direction of interest rates over the medium to long run is debatable. Do forces of structural technological disruption keep inflation muted even as the economy stabilises and unemployment rates fall? Or does the recent uptick in commodity prices and recovery in growth in emerging markets as well as the EU suggest that a synchronised global recovery is likely to pressurise inflation upwards? My two cents: any rise in rates will be massively positive for HSBC. If rates do not rise, this current synchronised global recovery, in itself, lends itself to higher credit demand and therefore better top-line growth.

With more than adequate capital, years of cost cutting and optionality, I think HSBC is a good business to own for the next 12-18 months in the least. I do not think we can re-visit the gung-ho years of the 1990s when HSBC grew rapidly and its price-to-book valuation reached well over 2.5x. But at current valuations of just around 1x book value and a 5% dividend yield, we can be paid to wait. With so much weight gain, HSBC is not a pushover anymore.

Headline aggregate results from the FY17 reporting season were strong, with 18% earnings growth recorded. However, the result was heavily supported by the Resources sector. Disruptive and cyclical challenges remain a feature of the market and weighs heavily on the outlook for certain market segments. Strong liquidity, a supportive dividend yield and a focus on capital discipline are key supports for the market, although these characteristics are not uniform across the market.
Key themes emanating from the results season include:
1) Strong headline growth, but patchy underneath
2) Strong free cash flow underpinned capital return and improved balance sheets
3) Disruptive and cyclical challenges persist
The market’s valuation has remained reasonably consistent with longer term measures, but a fair degree of uncertainty remains. Fortunes across the market will be mixed and therefore reliant upon active fundamental analysis and professional portfolio management to yield the best outcomes.
Access our full report
Buying emerging market (EM) equities can improve the outcome of an investor’s global equity allocation. EMs demonstrate higher GDP growth than developed markets (DM), which translates to higher earnings growth and – over the long term – higher total return to the equity investor. However there are periods in which one asset outperforms the other and the disparity between the two can swing significantly in a short period. Maintaining an EM exposure as part of the global equity allocation removes the need to attempt timing shifts between the two and over the long-term delivers a superior outcome to a solely DM exposure.
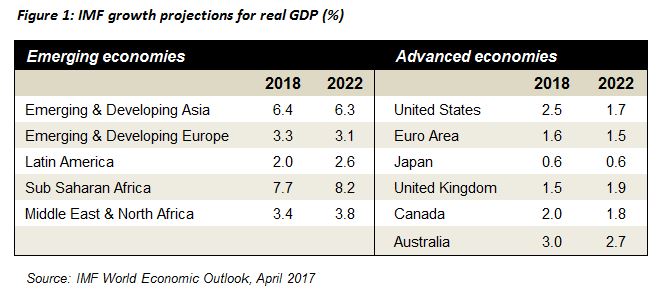
i) EMs deliver higher GDP growth
EMs are not homogenous and the countries within the universe exist right along the spectrum of economic development. Levels of GDP growth in EMs can also be more volatile than in developed. Nevertheless, it is possible to demonstrate that there are generally higher levels of GDP growth in EMs, given less mature economies. The IMF’s growth projections are shown in Figure 1.
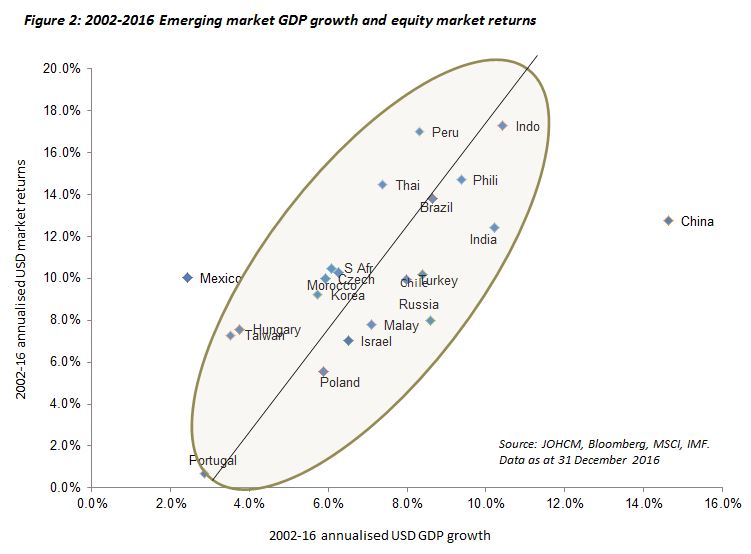
ii) Higher GDP growth translates to higher equity market returns
There are ultimately two drivers of equity returns: earnings growth and valuation. Valuations can have a significant impact in the short-term, but are ultimately mean-reverting. Over the long term, however, it is earnings growth which has the greatest effect upon equity returns. The ultimate effect is that – contrary to a common misconception – over the long-term there is an observable and positive relationship between GDP growth (via the medium of growth in corporate earnings) and equity market returns for almost all EMs (Figure 2).
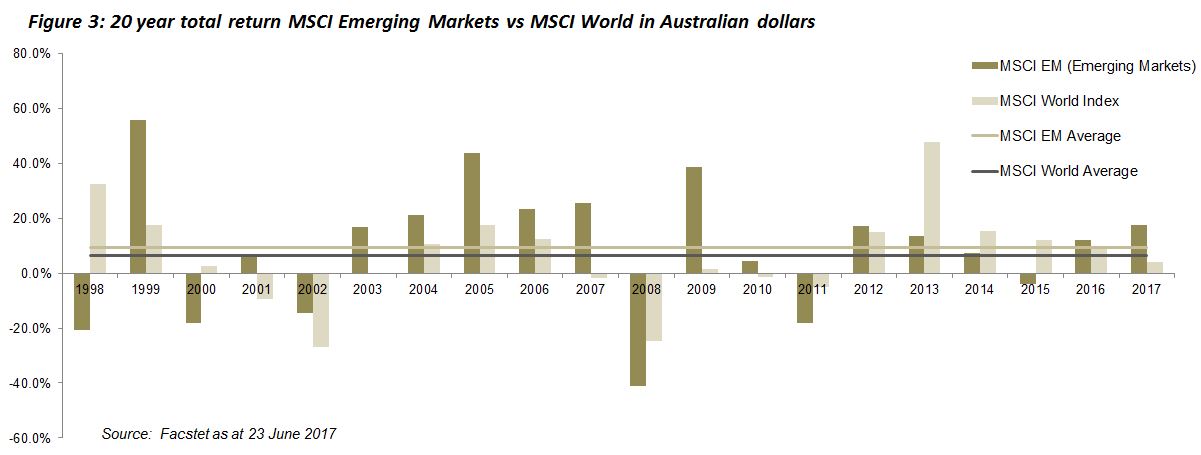
The upshot is that, at an index level, EMs have delivered superior returns to DMs over the last twenty years, as demonstrated in Figure 3. Over this period, the average calendar year return for MSCI Emerging Markets has been 9.13% versus 6.56% for the MSCI World – a difference of 2.57% pa (all AUD). In US dollars, MSCI Emerging Markets has returned 12.39% pa, versus 7.83% for MSCI World, a difference of 4.56%.
iii) Differing growth profiles brings benefits from diversification
Emerging and developed markets have historically displayed different growth profiles. For example, in the period from 2001 to 2007 EMs significantly outperformed DMs. However, more recently, from 2001 to 2015 it has been the other way round. These periods have often included a ‘stand-out’ year where one asset has significantly outperformed the other – such as 2005 and 2009 for EMs and 2008 and 2013 for DMs. Crucially, relative performance between the two can swing quickly. For example, EMs significantly underperformed DMs by 20.9% in 2000, then outperformed by 15.4% the following year. Likewise, in 2008 EMs underperformed DMs by 16.1%, then swung about to outperform by 37.4% the following year (all figures in AUD).
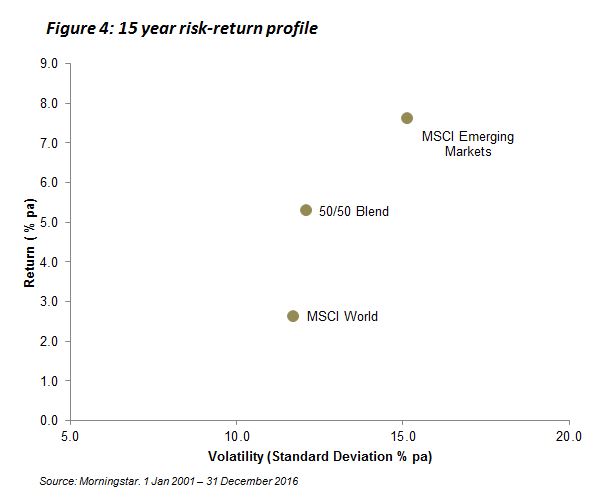
Maintaining an exposure to EMs as part of a global equities allocation removes the imperative to try to time these significant and often swift swings in sentiment. Figure 4 demonstrates that a simple 50/50 split between MSCI World and MSCI Emerging Markets would have delivered a significantly higher return, at a very small increase in risk, than a purely developed market portfolio over the last fifteen years.
BT Wholesale MidCap Fund (APIR code BTA0313AU)
Effective 18 September 2017, the BT Wholesale MidCap Fund’s (Fund) benchmark changed its name from S&P/ASX 150 ex 50 Accumulation Index to BT MidCap Custom Index.
Why has the benchmark name changed?
The benchmark name change has occurred to comply with the terms of BTIM’s licencing agreement with the Fund’s benchmark provider.
What does this mean for investors?
There is no material change to the Fund’s benchmark.
From the Fund’s performance reporting perspective, the benchmark performance history will remain the same and there are no material changes to the benchmark’s calculation methodology or inclusion rules.
If you have any questions, please contact the BT Customer Relations on 1300 346 821 between 8.00am and 5.30pm (Sydney time), Monday to Friday.
New Fees and Costs Disclosure Requirements for Product Disclosure Statements
The Australian Securities and Investments Commission (ASIC) issued new fees and costs disclosure requirements through ASIC Class Order 14/1252 and Regulatory Guide 97 – Disclosing fees and costs in PDSs and periodic statements (RG97). In accordance with these new requirements we have updated our fees and costs disclosure in our Product Disclosure Statements, which should be read together with the Additional Information to the Product Disclosure Statements (collectively the ‘PDS’).
The enhanced fee and cost disclosure requirements aim to provide investors with more consistent and comparable fees and costs across all superannuation and managed investment products.
Changes to BTIM’s PDSs
Under the new fees and costs requirements, the way we disclose management costs in our updated PDSs, issued 18 September 2017, has changed.
Previously, the management costs disclosed consisted of the following components; issuer fee and any expense recoveries and performance fees (if applicable). Management costs disclosed in our PDS now also include indirect costs.
Indirect costs are certain costs which we reasonably estimate have reduced, directly or indirectly, the return of a fund. Indirect costs may include underlying investment manager fees and costs, performance related fees (if applicable) and certain derivative costs. They are reflected in the unit price of the fund and are not charged to investors as a fee or retained by BTIM.
Our updated PDSs also include changes to the disclosure of performance fees and disclosure of transactional and operational costs and borrowing costs (if applicable).
How do these changes impact investors?
It is important to note that although there is added disclosure of fees and costs, there are no new fees or costs, no increases to any fees and costs being charged to investors nor any changes in the way fees and costs are charged. This means that the returns of the Fund (and therefore an investment in the Fund) are not impacted by these changes.
If you have any questions about these changes, please contact BT Customer Relations on 1800 813 886 between 8.00am and 5.30pm (Sydney time), Monday to Friday.