In our recent research trip members of our BTIM Concentrated Global Shares Team met with a range of CEOs, CFOs, operational heads and investor relations contacts at companies across multiple cities in the US (Seattle, Chicago, Boston and New York) and Europe (London, Paris and Berlin). On this trip we focused primarily on our industrial businesses based in the US and the global consumer beverage, restaurant and media names based in Europe. While our primary interest was on specific operational updates from our investee companies, we also widened the lens on Europe to gauge how the broader economy is progressing along some semblance of recovery and how that may evolve over time. Data observations on the European economy in recent months have been painting a picture of iterative improvement in consumer and business conditions so it is prudent to delve deeper at this point in time.
“Investors will be well rewarded by taking a genuine long-term approach to allocating capital to European equities”
Our broad range of meetings (sample list below) reaffirmed our positive view that the world’s economies are on the mend and the major European domestic economies are well positioned to see growth in manufacturing, further reductions in unemployment, rising asset prices and favourable conditions for businesses linked to the domestic economy. We believe investors will be well rewarded by taking a genuine long-term approach to allocating capital to European equities. Currently, our Concentrated Global Equity Fund has over 28% invested in European and UK equity positions.
Companies visited – June 2017
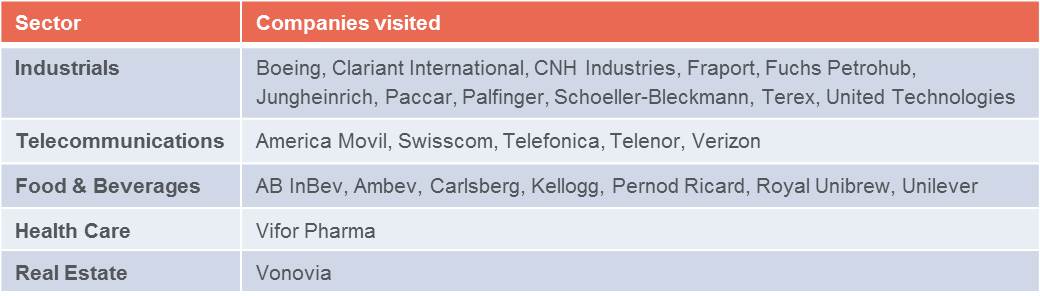
In overall terms, our meetings with industrial companies confirmed our positive views on their respective industries. Regular readers of our monthly and quarterly commentaries would be well aware of our positive views and associated meaningful positions in the aerospace industry so we are taking the opportunity through this article to provide an update from our visit to Boeing’s headquarters. Boeing is one such aerospace business held within our Fund.
______________________________________________________________________________________________________________________________________
![]()
Operational update
The key objective of our research agenda for Boeing was to gain a deeper understanding of the underlying demand dynamics that support aircraft production. We also sought to understand and assess management’s strategy to return free cash flow – the net revenue generated from ongoing operations – to shareholders.
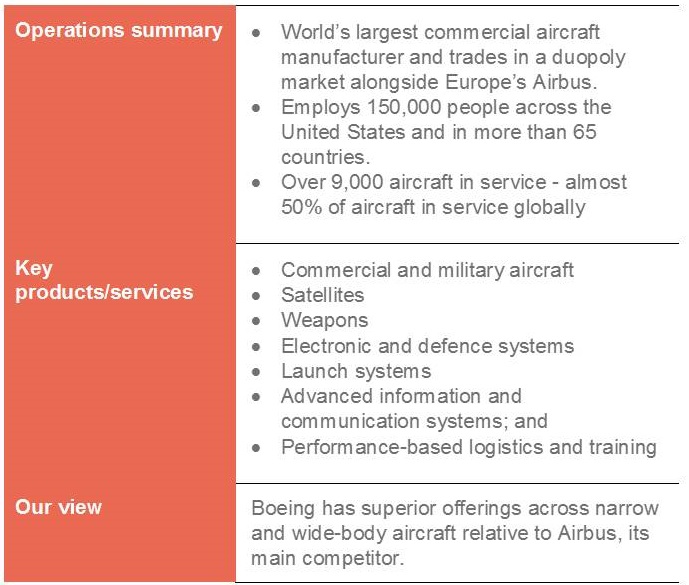
Following these discussions, our assessment of Boeing’s prospects remains positive. The company has successfully managed earlier technical issues with the Dreamliner 787, which has allowed management to focus on improving the program’s economics. Cash-based breakeven was achieved in the second quarter of 2016 and profitability has improved in each subsequent quarter through cost reductions and the sale of more profitable variants of the 787.
At the same time, production of new aircraft continues to accelerate. Factoring in the company’s strong order pipeline, the cash flow and earnings power of Boeing is well supported over the coming years. We don’t expect the development of the next generation of aircraft to disrupt Boeing’s cash flow growth as expenditure for the new 737MAX-10 and ‘middle of the market’ aircraft will coincide with the completion of existing program investments. If approved for development, the ‘middle of the market’ aircraft could deliver Boeing a significant gain in market share. This new offering is designed to fill the market gap that exists between the 737 and the 787, which at the very least, would improve the economics for routes where the 787 is perhaps not best suited. The more significant opportunity for this aircraft is to introduce new routes for airlines, which will drive incremental demand for new aircraft. Our feedback from aviation industry observers suggests the market for such an aircraft would be around 4,000 units.
Industry outlook
Lower real travel costs, thanks to lower fuel costs, more routes, strong economic fundamentals in the US and signs of recovery in Europe, bode well for growth in airline traffic. The International Air Transport Association (IATA) recently upgraded their forecast passenger growth for 2017 to 7.2%, significantly higher than the longer term average of 5%.1
Performance relative to competitors
This year’s Paris Air Show, the world’s premier exhibition for the aerospace industry and a key forum for attracting aircraft orders, provided a good opportunity to corroborate the strong demand Boeing is seeing from airlines. Boeing outsold Airbus at the show, with 571 firm orders and commitments for new aircraft, compared with 336 recorded by Airbus. At list price, the Boeing orders could potentially gross US$75 billion in revenue.

New aircraft on exhibition at Paris Air Show. Source: parisairshow.tv
Conviction in management
Boeing’s Chairman, President and CEO, Dennis Muilenburg, is a highly regarded operator and knows the business intimately. Muilenburg’s tenure with the company dates back to 1985 and he was appointed as CEO in July 2015, with subsequent appointment as Chairman of the Board in March 2016. . Muilenburg and the Board have maintained a commitment to delivering shareholder value, with a stated goal of returning a majority of the company’s free cash flow to shareholders. Since taking the helm, this commitment has seen the company deliver strong dividends and maintain commendable discipline in capital expenditure – credentials that look for within our process.
Conclusion
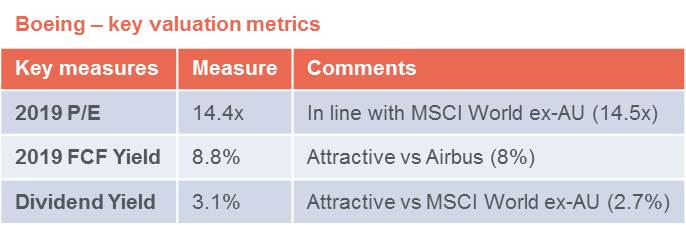
Our continuing discussions with company representatives give us confidence that the new management team are focused on assigning more operating authority to their unit heads which, over time, should encourage more entrepreneurial ownership behaviour. This will result in lower capital expenditure, lower research and development costs and higher production efficiencies being extracted. Management remains committed to delivering 100% of the free cash flow to shareholders and we are happy to continue to hold this business in our portfolio for the foreseeable future, especially considering the business is trading on an adjusted free cash flow yield of 9%, compared with 8% for Airbus.
1. Source: World Bank
______________________________________________________________________________________________________________________________________________________________________
The Bots have landed…at a pharmacy?
We have all heard stories of robots taking human jobs, be it in the automobile manufacturing industry, transportation, asset management and financial advice service areas, and there is no doubt the trend is accelerating. 
There was no better example of this acceleration than a recent site visit to a high street retail pharmacy in downtown Berlin, where robots were dispensing prescribed medicines directly to the consumer. All that is required is your doctor’s script which is entered by the sales clerk into the cashier terminal and within one minute your product is dispensed, complete with labelled instructions on dosage. The system is fast and efficient, providing an end-to-end inventory and billing management process to facilitate increased compliance. With one less head count in the store and no need to accommodate a lunch break, the productivity gains are significant.
It will be interesting to see how long this technology takes to arrive in Australia and the reaction from the Pharmacy Guild of Australia. We can see early interest from the discount pharmacy chains, given their model is geared towards high turnover / lower margin.
Naturally, this system would require some change in practice for doctors, many of which still issue hand written scripts with scribe quality that is often at odds with their level of intelligence. Of course, machine learning may come into play here and the bots will no doubt progressively learn to decipher the most illegible doctors’ scrawl.
We monitor disruptive developments like these emanating from offshore markets to consider the implications for investors. Not only will pharma-bots be a win for consumers, the major pharmaceuticals manufacturers will naturally hold a vested interest in the more efficient delivery of their product to consumers. It is plausible to see companies like Merck, Sanofi and Pfizer pursue a direct distribution model and develop ATM-style dispensaries installed at convenient sites like your local café. A skim latte, blueberry friand and 250mg of Penicillin please!

The Australian ethos is built upon “a fair go for all”. It’s an ideal that captures a range of emotive applications and while being largely aspirational, it’s a virtue that resonates across the community and keeps policy makers and the population at large generally in check. At its core is to ensure that social norms are maintained through economic growth and development. Sadly, the same ethos is often found lacking in other countries, where a lack of regulation, corruption and gross inequality can lead to the exploitation of people, often for the benefit of large corporations including those in Australia. The potential financial costs associated with lapse controls and policies in supply chain management can prove fatal for businesses that fail to manage these risks.
“Incorporating ESG factors into the company’s sourcing and purchasing practices is now being viewed as good business practice”
Corporate supply chains are bigger and more complex than ever before. Wesfarmers recently reported it has relationships with over 15,000 suppliers in more than 20 countries.1 Consumer pressure for eco-friendly goods and services supports the notion that sustainable supply chains can be profitable supply chains. In other words, incorporating environmental, social and governance (ESG) factors (such as human rights) into the company’s sourcing and purchasing practices is now being viewed as good business practice.2 What that also means though is that if a supply chain activity results in the violation of an environmental, labour or human rights standard or regulation there can be material negative financial and reputational outcomes.
It can be difficult to identify human rights risks given the complex nature of supply chains across many companies. However, changes in regulatory disclosure requirements is prompting us as an industry to revisit human rights issues, including what is termed ‘modern slavery’. It is tempting to believe that modern slavery only exists abroad, but in fact it is closer to home than many of us realise. Below are some key points to bring readers up to date on this important issue.
Modern slavery: shape and form
Modern slavery is a significant issue impacting the lives of millions globally. It encompasses all forms of human trafficking, forced labour, debt bondage, forced marriage and child labour which stem from cultural attitudes or as a consequence of human tragedies such as conflict, poverty or natural disasters. A Global Slavery survey by Walk Free Foundation estimates that 45.8 million people have been subjected to modern slavery between 2011 and 2016. Modern slavery is estimated to prevail across 167 of the most populous countries. The majority of these are concentrated within our own Asia Pacific region.3
Slavery exists in Australia
Unfortunately, cases of modern slavery have been identified on our soil as well as through indirect forms, where Australian companies with offshore operations or sub-contracting arrangements have been linked to cases of modern slavery. The Walk Free Foundation survey suggests an estimated 4,300 victims of modern slavery exist within our borders. Individual cases have been cited with exploitation of workers – often migrants – being employed ‘off the books’ in labour intensive work.
The use of modern slavery tends to be concentrated in food and agriculture production, textiles, retail and technology industries. These industries often feature the use of complex and constantly evolving global supply chains, making it difficult to monitor and manage, even for the companies involved. However, no industry is immune and companies can ill afford to be complacent.
Historically, the absence of company data and regulation has meant it was difficult to assess the risk of exposure to modern slavery in corporate operations and across supply chains. However, a series of multi-stakeholder initiatives, legislation and engagement activity globally, including Australia, are changing the investment landscape.
Government actions
Legislation to address the issue of human rights violations and poor labour practices is now either in existence or in the process of being enacted in Canada, the US, the UK, France, The Netherlands and Switzerland. The UK is the most recent market to pass legislation through its UK Modern Slavery Act (2015). Enactment of the legislation has not only made a significant impact in promoting compliance but importantly, has put the issue of transparency on corporate agendas. Public entities in the UK are now required to report on measures taken to address modern slavery in their business and supply chain. Australian companies which operate in the UK such as BHP Billiton, Lend Lease, Qantas and Wesfarmers already report on their anti-slavery efforts under this regime, so a degree of harmonisation with Australian initiatives already exists.
Globally, some of the largest retailers and manufacturers are starting to audit their lengthy supply chains in response to growing scrutiny. For example, Woolworths, Wesfarmers and other retail operators in Australia established the Retail and Supplier Roundtable Sustainability Council to take action against abuses occurring within their supply chains. Early evidence suggests the introduction of legislation on human rights due diligence in the UK and US is working to improve the quality of related corporate disclosure practices. This in turn helps investors make better informed investment decisions and also supports stakeholder engagement with companies to mitigate residual risks.
Many in the local investment community were encouraged by the announcement earlier this year by the Australian Federal Government that it had commissioned a Senate Inquiry into the establishment of our own Modern Slavery Act. To date, over 180 submissions have been made to the inquiry, including from large Australian companies such as Wesfarmers, Woodside Energy, Rio Tinto, Woolworths, Qantas, Fortescue Metals Group and BHP Billiton.
Developing a regime that is effective
As an investment manager, we believe failure to consider ESG factors in a company’s operations or supply chain can present potential financial impacts through reputation damage, litigation and operational risks which may ultimately harm a company’s social license to operate – all of which can be costly and time consuming to restore. Of course, the cost to society and the economy more broadly can also be significant and severe.
“modern slavery is not just a human rights issue; it is also a financial issue with potential material implications for investment portfolios”
An Australian Modern Slavery Act would assist companies with reporting and in turn, allow investors to more accurately assess and price risks to make more informed investment decisions about companies engaged in offshore sourcing.
Growing power of the social conscience
Consumer preferences for eco-friendly goods and services mean the link between a company’s sustainability performance and consumer loyalty is growing.4 As an industry we need to be alert to the fact that modern slavery is a very real and often a hidden risk in a company’s operations and supply chain. Furthermore, we also need to focus on the fact that modern slavery is not just a human rights issue; it is also a financial issue with potential material implications for investment portfolios. Violate human rights regulation and you pay twice: the fine for the breach and the damage to your brand with a related drop in sales and possible funding.
Encouragingly, stakeholders (customers, shareholders and government bodies) are now actively engaging with businesses to take action to address their exposure to human rights issues such as modern slavery. Companies that establish a whistle-blower policy, consolidate supplier arrangements and build loyalty through greater transparency will be recognised as industry leaders.
The rise of investor awareness of ESG issues in the past few years, combined with changes in the regulatory landscape and shareholder tolerance towards human rights violations has brought the practice of what is termed modern slavery to the fore. Meaningful disclosure of supply chain management and related steps to mitigate modern slavery risks when integrated alongside traditional financial drivers can contribute to a company’s competitive advantage and strengthen its long-term financial stability. Multi-stakeholder initiatives, regulation and engagement activity are all working to support the business case for integrating social issues such as modern slavery risks into the investment decision making process. Investor and consumer voices are becoming louder and ignorance is no longer an option.
1. “Submission from Wesfarmers to Senate Inquiry into Modern Slavery to AMS submission” 2017.
2. Economist Intelligence Unit (EIU) 2015 global survey of 853 senior corporate executives found 62% of respondents think that ”avoiding repeats of the Rana Plaza factory disaster in Bangladesh is primarily the responsibility of multi-nationals that purchase products from these factories not the Bangladesh Government”.
3. Walk Free Foundation, “Global Slavery Index 2016”.
4. Studies like the Nielsen Global Survey on Corporate Sustainability (2015) which covered 30,000 consumers across 60 countries found that 73% of millennials are willing to pay more for sustainable brands, compared with 50% in 2014.

“Xiang Junbo, chairman of China Insurance Regulatory Commission (CIRC), is currently under probe, according to China’s top anti-graft authority.” – Xinhua,9 April 2017
April’s news that the third of China’s three financial regulators would have a surprise change of leadership was not immediately attention-grabbing. With CSRC, the markets regulator, changing its head in February 2016, and CBRC, the banking regulator, following the same move in February 2017, there has now been complete change at the top of this part of the regulatory system (Zhou Xiaochuan remains Governor of the People’s Bank of China (PBoC), the central bank). Whilst all three regulatory heads would be expected to change in a Party Congress year, we can now see that something different is happening.
“Any bureaucrat pursuing policies that threaten the stability of China should be prepared to be replaced.”
James Syme, Portfolio Manager
We have written extensively about our concerns that the credit stimulus applied to the Chinese economy in mid-2015 would have negative side effects and would ultimately prove to be unsustainable. Our concerns were that some combination of the growing risks from leverage within the financial system, rising inflation, downward pressure on the currency and/or worsening urban pollution would cause a reversal in policy. Ultimately, we see the primary objective of the Chinese Communist Party as not being growth, as is often thought, but rather stability. Any bureaucrat pursuing policies that threaten the stability of China should be prepared to be replaced.
We have recently seen a number of data points that confirm we are in a period of substantially tighter monetary policy in China. As is normally the case, monetary policy is being administered through a mixture of interest rates and macro-prudential rules and quotas.
Firstly, it is definitely the case that all-system claims are growing at a much slower rate than a year ago. The most recent increase, 14.1% in the year to May 2017, is the lowest since the 2008-9 financial crisis, and compares to an increase of 20.8% in the year to May 2016. Interestingly, it is the non-bank financials where the slowdown has been hardest. On a related note, the three month Shanghai interbank interest rate has been above 4.5% for the last few weeks a sharp increase on a rate of 2.8% as recently as November 2016.
Secondly, in late June the CBRC ordered China’s banks to review the ‘systemic risk’ from a group of high-profile Chinese conglomerates that have been aggressively making overseas acquisitions in recent years. The targeted groups appear to be Dalian Wanda, Fosun International, HNA and Anbang (the unlisted insurer whose CEO, Wu Xiaohui, was recently arrested). These groups have been borrowing significantly and have bought some trophy assets including the Waldorf Astoria hotel in New York. It seems that policy makers are as concerned about the specific uses of credit as they are about the overall rate of increase.
Thirdly, in the offshore bond market, June saw a massive US$6.6 billion bond issue by property developer, Evergrande, which surprised investors. It means that so far in 2017, Chinese property developers have raised US$14.9 billion through offshore bond financing, which is a huge increase on the total of US$14.4 billion for the whole of 2016.
Hence, slower credit creation particularly outside of the banking sector, new regulators, regulatory crackdowns on the most aggressive borrowers, and heavy users of the bond market turning to the offshore market, means that the stimulus is over for now. The implications of this for emerging markets are mixed and have to be considered alongside other factors such as a recovering Eurozone and lower US bond yields. But what we can say is that this is unambiguously negative for commodities, commodity stocks and commodity-exporting countries.
“I’ve been turning over in my mind the question of nostalgia, and whether I suffer from it. If nostalgia means the powerful recollection of strong emotions and a regret that such feelings are no longer present in our lives, then I plead guilty.” – Julian Barnes, The Sense of an Ending.
In commemorating the 20th anniversary of the handover of Hong Kong to China on 1st July 2017, I’ve taken the liberty of the author’s gavel and the indulgence of my colleagues overseeing the editorial oversight to stray a bit off the beaten path with this article.
I landed at Kai Tak Airport in Hong Kong (HK) on 22nd February 1997. Flying seemingly a hair’s breadth away from those dilapidated low-rise buildings reminded me of similar ones I’d seen before. Television antennas grew from terraces while roads below were narrow and crowded. My first impression of HK – ‘this is no different from Bombay; here too they hang their clothes to dry in the balcony’.
The drive into the city was short and as I approached the central business district (CBD), HK’s famed skyline came into view. Much of that view has changed in the past two decades. The CBD’s waterfront boundary has edged ever closer towards Kowloon across the harbour. It is an enduring lesson about HK and capitalism – selling reclaimed land is probably the best business model in the world for the Government of HK. That reclaimed waterfront land sells at astronomical values once it is filled up with rocks and debris, which costs almost nothing.

Source: Rating and Valuation Department, CEIC
Little did I know that I had arrived in HK on the cusp of the Asian Financial Crisis. My mind was preoccupied with thoughts on adjusting to life in a new city. Born and raised in India, this was my first time living abroad. After the luxury of a two-week fully paid stay at the Ritz Carlton (courtesy the investment bank I worked with), I found a tiny apartment with no view in a matchstick-thin building in the Mid-Levels. The monthly rental was US$2,800 for 540 square feet of liveable area. After the SARS epidemic in 2003, its rent had halved to US$1,400 but today that same place rents for US$4,000/month.
Life settled into a routine between an escalator commute up and down the hill to work, Sunday dim sum at the City Hall past the bird-like cacophony of helpers on their day off, occasional hikes to easily accessible scenic country parks and exploring HK’s neighbourhoods and its British legacy. By June 1997, Asian financial markets were in a frenzied, bullish phase. My colleagues were actively investing in stocks or properties funded by leverage. I was bewildered and awestruck, having grown up in a Nehruvian socialist India where wealth was frowned upon. Newspapers featured the imminent handover of HK from the UK to China under the ‘one country two systems’ arrangement. In 1982, negotiations between the diminutive, expressionless Deng Xiao Ping and the stern faced iron woman Thatcher to resolve the issue of sovereignty of HK were acrimonious. A middle ground was reached where HK would become part of China on 1st July 1997, though with a special status for 50 years. Leading up to the handover in 1997, there was renewed confidence in HK and China.
30th June 1997 was a holiday to mark the Queen’s birthday. As I wandered through Central, I noticed a serpentine queue outside the GPO. With a passing interest in philately I joined the line to buy some official memorabilia commemorating the historic event. I returned on 1st July, the day of the handover, this time to get the newly issued Hong Kong Special Administrative Region (HKSAR) postage stamps. As the wait for first day covers was rather long, I opted for the shorter line to get our envelopes with postage stamps franked. Uniformed staff sat behind long tables mechanically franking the ’date chop’ on postage stamps as the queue shuffled along. I presented my envelopes. A couple of minutes into his routine, the official stopped abruptly. He stared down at the envelope and looked up at me. In that instant it struck me. I snatched the whole pile. He thundered, ”Hand It Over!” By then, I had darted out of the door.
Serendipitously, I had managed to get envelopes with postage stamps of the Queen’s head but with a HKSAR official frank dated 1st July. Those postage stamps had ceased to be legal tender on midnight of 30th June 1997. Thus I believe I have in my possession the only known postage stamps issued by a British colony but franked and dated 1st July 1997 by the HKSAR under Chinese sovereignty; a unique piece of history.
I now live in another clean, efficient and vibrant city – Singapore. But I do miss HK. The good friendships, the Hong Kong Cricket Club, HK’s rolling hills and walks, the hustle and frenzy of city life, resilience of its people and the seasons. The Asian Financial Crisis and SARS are distant memories. Its people have survived through good times and bad and so much has changed over the past 20 years. The city has definitely prospered as reflected by the gleaming new buildings. Life for the average person seems tougher as evidenced by the protests against increasing mainland Chinese influence. Attitudes towards China went from apathy pre-1997 to euphoric embrace during the 2000’s to suspicion and fear in the past couple of years. Yet, whenever I return, the view of the skyline still mesmerises me.
To give nostalgia its due, much like the enduring question binding Americans of a certain generation, “what were you doing when JFK was assassinated?”, when queried about my most memorable moment of the HK handover, the answer is simply a resounding clerical shriek: “Hand it Over!”
While Emerging markets (‘EMs’) have underperformed Developed markets (‘DMs’) over the period 2011-2016, as we stand today there are clear and compelling opportunities in EMs. However, there are also countries facing stiff challenges and political malaise. The key is to be selective in what you own.
The challenges in EMs include central banks tightening – higher DM rates and less liquidity has historically been a headwind for those EMs with current account deficits (Latin America, ASEAN). Expectations about the pace and terminal value of the US rate cycle have been waning in recent months. Nevertheless, countries such as Brazil are battling to control the FX depreciation and inflation that has resulted from capital outflows. In several instances – again, like Brazil – this process is complicated by the political instability and populist backlash that can accompany an economic reversal. As we suspected, the market’s euphoria surrounding President Rousseff’s impeachment proved premature.
There are also those EMs who enjoy current account surpluses and who benefit from the improvement in growth implied by higher rates – notably the East Asian exporters (Korea, Taiwan).
Our current positioning:
• Buy global cyclical growth – especially in Korea and Taiwan
• Buy India for the domestic recovery
• Remain cautious on China as stimulus slows – own growth/consumer stocks
• Underweight Latin America – commodities, politics, economic malaise
• Avoiding Turkey; Mexico is looking interesting
Figure 1 below shows the Fund’s country positions as at end May 2017. This demonstrates the high-conviction approach we take to country allocation.
Figure 1: BT Global Emerging Markets Opportunities Fund – Wholesale country allocation end May 2017
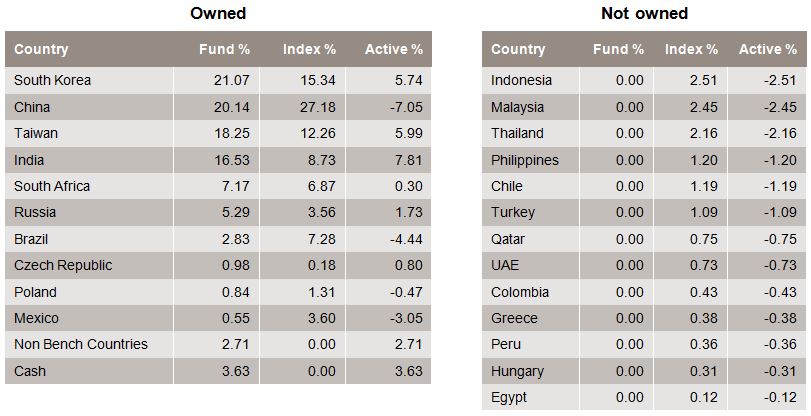
The table below demonstrates our current views on four countries within the context of our five-point framework: three of our largest overweight (India, Russia and Korea) and our largest underweight (China).
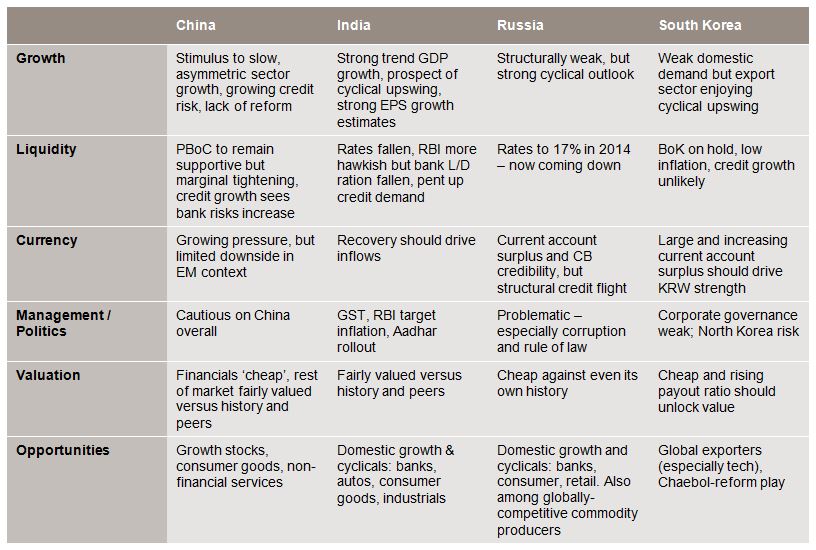
The key point is that EMs, given their diversity, do not perform in the same way in a given environment. As always, there are countries that look very attractive at these levels. There are also those that you want to avoid. This is why a country-driven approach is crucial.

The Australian retail sector is facing two challenges: a cyclical challenge caused by a slowing economy and a long-term structural threat from digital disruption (ie Amazon). In this brief note we will leave the digital challenge for another day and take a look at the retail slowdown and its implications for the retail property sector.
The weakness we’re seeing in the retail property sector is reflective of some key underlying dynamics. It is therefore instructive to understand the background issues before discussing how to navigate this new slower environment.
Firstly, it is fairly intuitive to draw a link between the performance of retailers and consumer activity. There is a well-observed flow-on effect from changes in household incomes, inflation and consumer sentiment towards an individual’s future financial position. An environment where incomes grow, employment conditions remain stable and the price of goods and services grow at a moderate rate bodes well for spending. This was quite prevalent in the cyclical upturn following the GFC when retail sales in the malls accelerated to around 5% pa. However, retail sales growth is back to just below 2% pa. This slowdown is occurring despite a large uplift in residential property values, especially in Sydney and Melbourne.

What is causing weakness in the consumer sector here in Australia? The following charts help to explain how the consumer feels. Firstly, there is very little wages growth; in fact the series is at its lowest level since 1997 and wages have been tracking below inflation for almost two years. In response to falling real wages, the consumer is hunkering down and devoting a greater proportion of household disposable income to servicing debt.
Australian wages growth is anaemic
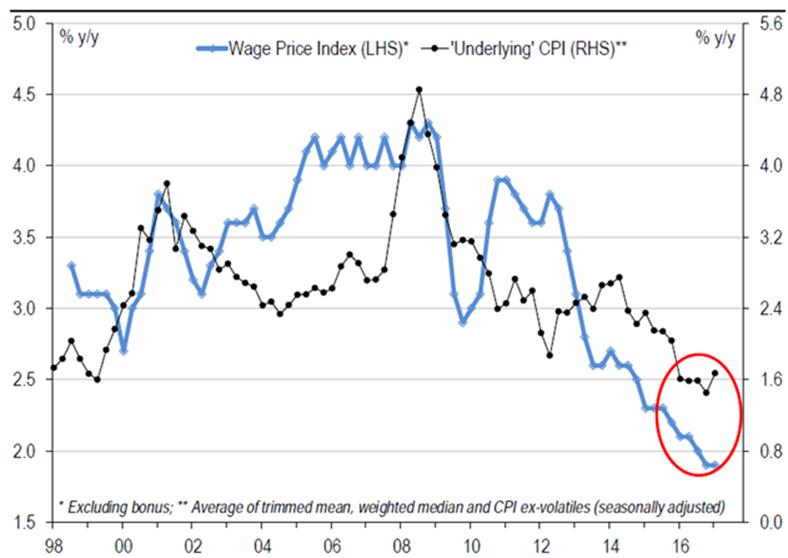
Source: UBS
One of the reasons behind weak wages growth is simply that the workforce is more casualised and participation rates are falling. Not everyone who wants to work gets a job or gets enough hours when they are working. In fact, if you held participation rates and hours worked constant, the underlying unemployment rate would be almost 10%.
Australian underemployment is rising

Source: Macquarie Equities
Another background issue is the repricing of mortgage books by Australian banks. There is roughly $1.6 trillion of mortgage debt in Australia. Surprisingly, 40% of that debt is within interest-only loans. That high share of interest-only Ioan debt has caused concerns for the RBA and APRA which have those interest-only debt books firmly in their sights. In response, we have seen out-of-cycle rate hikes by the banks in an attempt to rebalance the books away from interest-only debt. The table below highlights the rate increases that have occurred over the past year. The interest-only book has increased by an average of 80 basis points. Based on $660 billion worth of interest-only debt, that equates to an additional $5 billion in interest costs per year. Putting that into perspective, the higher interest costs equate to 1.5% of retail sales, which goes some way to explaining the flow-on effect at the point of sale.
Dynamic loan pricing at Australia’s major banks – interest rate hikes in 2016-17

Source: BT Investment Management
Finally, the consumer also faces rising school fees, healthcare, electricity and gas prices (+20%), all of which will constrain spending at the malls.
Positioning for consumer weakness
Given the weak environment for retail, our portfolios have an underweight position in the sector, with exposure to retail focused on Scentre Group – the highest quality retail name in Australia. Scentre Group owns 14 of the top 20 shopping centres in Australia which includes prime Westfield malls like Bondi Junction, Sydney and Doncaster in Melbourne.
The vertically integrated structure of Scentre Group’s operating platform provides the business with a very strong competitive advantage. The company controls all elements of the asset operations development, design and construction, leasing, marketing and management. This has enabled the group to achieve development returns and operating metrics that are superior to its industry peers. The favourable development returns generated by Scentre Group in part reflect the quality of the assets, which forms a strong working model for generally high productivity in the existing centres and this experience is applied to new developments.
Trends in retail sales and consumer sentiment suggest the retail industry in Australia will be operating through a challenging environment in the months ahead. Our approach is to limit exposure to the retail sector to high quality names and weight our portfolios to towards other segments such as high grade commercial property.
14 June 2017
Notice of Termination: BT Australian Share PST (ABN: 40 573 184 010)
The BT Australian Share PST (Fund) will terminate effective Wednesday, 20 September 2017 following the required notice period set out in the trust deed of the Fund.
The Fund will be closed to any further investments or withdrawals from 14 June 2017. To allow us to make any final tax adjustments proportionally, investors will not be able to access their investment until termination is completed.
The Fund will terminate effective Wednesday 20 September 2017 and as soon as practicable, the remaining assets in the Fund will be realised and the proceeds distributed to all investors in proportion to their unit holding. This payment is currently expected to be made in early October 2017.
A letter has been sent to existing investors and advisers with clients invested in the Fund providing additional information regarding the termination.
14 June 2017
Notice of Termination: BT Conservative Outlook PST (ABN: 83 493 016 882)
The BT Conservative Outlook PST (Fund) will terminate effective Wednesday, 20 September 2017 following the required notice period set out in the trust deed of the Fund.
The Fund will be closed to any further investments or withdrawals from 14 June 2017. To allow us to make any final tax adjustments proportionally, investors will not be able to access their investment until termination is completed.
The Fund will terminate effective Wednesday 20 September 2017 and as soon as practicable, the remaining assets in the Fund will be realised and the proceeds distributed to all investors in proportion to their unit holding. This payment is currently expected to be made in early October 2017.
A letter has been sent to existing investors and advisers with clients invested in the Fund providing additional information regarding the termination.
14 June 2017
Notice of Termination: BT DIY Active Balanced PST (ABN: 90 963 319 535)
The BT DIY Active Balanced PST (Fund) will terminate effective Wednesday, 20 September 2017 following the required notice period set out in the trust deed of the Fund.
The Fund will be closed to any further investments or withdrawals from 14 June 2017. To allow us to make any final tax adjustments proportionally, investors will not be able to access their investment until termination is completed.
The Fund will terminate effective Wednesday 20 September 2017 and as soon as practicable, the remaining assets in the Fund will be realised and the proceeds distributed to all investors in proportion to their unit holding. This payment is currently expected to be made in early October 2017.
A letter has been sent to existing investors and advisers with clients invested in the Fund providing additional information regarding the termination
14 June 2017
Notice of Termination: BT Core Australian Share PST (ABN: 71 753 267 021)
The BT Core Australian Share PST (Fund) will terminate effective Wednesday, 20 September 2017 following the required notice period set out in the trust deed of the Fund.
The Fund will be closed to any further investments or withdrawals from 14 June 2017. To allow us to make any final tax adjustments proportionally, investors will not be able to access their investment until termination is completed.
The Fund will terminate effective Wednesday 20 September 2017 and as soon as practicable, the remaining assets in the Fund will be realised and the proceeds distributed to all investors in proportion to their unit holding. This payment is currently expected to be made in early October 2017.
A letter has been sent to existing investors and advisers with clients invested in the Fund providing additional information regarding the termination