Wages are up, growth is down and Australia is struggling. Developments this week only change the current economic narrative at the margin. Pendal head of government bond strategies TIM HEXT explains
- Find out about Pendal Government Bond Fund
- Browse Pendal’s fixed interest funds
Wages up
ON TUESDAY the Fair Work Commission (FWC) Annual Wage Review awarded an increase of 4.75% in award wages to 21.1% of the workforce, around 2.8 million workers.
As many of this cohort are casual or part time this impacts only 11.2% of the overall wage pool. Markets had expected something nearer 4% to 4.5%.
The RBA will be disappointed by this outcome, although they will not directly comment on it.
We estimate that this should add 0.2% to the closely followed Wage Price Index (WPI), although probably 0.1% was captured in the RBA’s recent WPI forecast of 3.2%.
Interestingly the FWC decision quoted the RBA headline inflation forecast of 4.8% for the end of June as its justification for the rise.
This forecast will likely prove too high given recent fuel price falls, so perhaps an inadvertent own goal from the RBA.
Growth down
On Wednesday the National Accounts for the March quarter were released. As always, the two-month delay makes it less useful as a pointy end indicator, but the breadth of information is very powerful.
Overall, the economy grew at only 0.3% in Q1, down from a revised 0.9% in Q4 2025. On a per capita basis we are again going backwards (-0.1%).
The public sector has stepped back from the major engine of growth to being flat in the quarter. Household consumption grew by 0.5%, near average. The only bright spot is the data centre impacted business investment that grew by 5.7% in a quarter, alone adding 0.7% to GDP.
Keep in mind the first two months of the quarter hadn’t been impacted by the Middle East developments that hit confidence. The economy was already struggling, hit by rate hikes and higher inflation.
Australia struggling
The biggest take from today’s data and other recent data is the rapidly changing external account position of Australia. This dragged 0.8% from growth. This is volume not revenue based.
Part of this was weather impacting our commodity exports. However, a growing part is the changing trade position, which is very interesting.
Australia has had a trade surplus since 2017, leaving the ‘banana republic’ days behind us.
The current account also includes our net interest payments, which detracts from the current account position as we are a net debtor to the tune of around $1.2 trillion.
However, by late 2018 even our current account was in surplus. Australia for probably the first time in history was an exporter of capital to the world.

Now in 2026 commodity export volumes have flatlined and a boom in imports, led by technology for data centres, has now seen even the trade position slip back into deficit.
This is likely to continue for some time, despite BHP’s (ASX:BHP) share price suggesting blue skies ahead.
If commodity prices significantly fall, the cracks could become a crisis of sorts for Australia, as we collectively increasingly spend our wealth on imports – think not just technology but new cars, overseas holidays and fuel.
By volume, exports are up 10% over the last decade but imports are up 35%. Only a favourable term of trade shift has helped somewhat prop up our position.
What does this mean for markets?
We will save a more in depth look at what artificial intelligence and data centres mean for the economy and rates for another time.
None of this week’s data on its own will tip the RBA into action or no action in August.
However, the data does play into a difficult period ahead for the Australian economy, as workers try to keep pace with inflation but the economy is yet to see the dividends of all the technology related infrastructure spend.
Find out about
Pendal Government Bond Fund
Tim Hext, Head of Government Bond Strategies
If you’d like to hear more about how Pendal’s Income & Fixed Interest team is positioning for this environment, please contact us through our accounts team
About Tim Hext and Pendal’s Income & Fixed Interest boutique
Tim Hext is a Pendal portfolio manager and head of government bond strategies in our Income and Fixed Interest team.
Tim has extensive experience in banking, financial markets and funding including senior positions with NSW Treasury Corporation (TCorp), Westpac Treasury, Commonwealth Bank of Australia, Deutsche Bank, Bain & Co and Swiss Bank Corporation.
Pendal’s Income and Fixed Interest boutique is one of the most experienced and well-regarded fixed income teams in Australia.
Find out more about Pendal’s fixed interest strategies here
About Pendal
Pendal is a global investment management business focused on delivering superior investment returns for our clients through active management.
In 2023, Pendal became part of Perpetual Limited (ASX:PPT), bringing together two of Australia’s most respected active asset management brands to create a global leader in multi-boutique asset management with autonomous, world-class investment capabilities and a growing leadership position in ESG.
Here are the main factors driving the ASX this week, according to Pendal’s head of equities CRISPIN MURRAY. Reported by portfolio specialist Chris Adams
EQUITY markets continue to rally, led by the US (S&P 500 +1.4% last week) as AI-related investment spending flows through to stronger earnings.
The breadth of winners is widening in the US. A strong update from Dell (NYSE:DELL) reinforced the enterprise hardware story, while a similarly well-received quarterly from Snowflake (NYSE:SNOW) showed some software stocks are benefitting from AI, as companies seek a control or orchestration layer.
Oil prices continued to fall last week (Brent crude -11.1%). This was due largely to the recurring prospect of a ceasefire and reopening of the Strait of Hormuz, as well as better availability of oil and fuel as Chinese imports slow and reserves are released.
The latter tailwind appears to be sustainable for a couple of months.
The fall in oil – combined with benign inflation data – led to lower bond yields which helped the interest-rate-sensitive part of the equity market.
The S&P/ASX 300 rose 0.9%, but still lags the US by 22% quarter-to-date due to a relative lack of semiconductor and other AI-related exposures.
Reasonable domestic consumer price index (CPI) data released last week saw lower expectations for further rate hikes and drove a rally in discretionary stocks.
The domestic tech sector continues to recover, outperforming the S&P/ASX 300 by 11.1% quarter-to-date, but still lags the broader market by 18% this year.
Bank stocks continue to lag, underperforming the market 5.5% in May.
Iran war outlook
A deal to reopen the Strait remains elusive for now.
The key issues appear to be:
- The timing of Tehran’s access to frozen funds relative to the Strait’s re-opening
- Wording around some acknowledgement of Iran’s influence over the Strait
- The framework for discussions on enriched uranium
One factor for the US is obtaining an agreement that’s not perceived to concede too much – particularly relative to the Obama-era Iran deal.
There is also disagreement over the number of ships now transiting the Strait, with some suggesting it is opening up.
Iran’s Islamic Revolutionary Guard Corps claimed there were 20 to 35 daily transits last week (compared to 95 pre-war).
But the International Monetary Fund’s PortWatch noted only four per day in the week to May 24 and Lloyd’s of London reported on May 26 that traffic was down by almost half compared to the previous week.
It may be that the IRGC numbers relate to permits issued (rather than actual transits) and may include Iranian traffic heading to other Iranian ports, which is not relevant to global fuel supply.
The conclusion is there is no tangible evidence that supply is improving.
Despite this, oil and fuel prices continue to fall.
This is more than just market optimism about a deal; it reflects the reality that there is ample supply, for now.
The drivers of this are:
- Chinese oil imports are estimated to have dropped from 12 million to 7 million barrels per day (bpd) in May. Some of this is demand reduction which is estimated at 9%, or about 1.5m bpd. The remainder is a draw-down on strategic reserves. Chinese demand has also fallen with a pivot to coal and renewables, adoption of electric vehicles (now estimated at a third of China’s transport fleet) and a switch from air travel to trains.
- Global demand loss for May is estimated at about 5.6m bpd (compared to 4.3m in April) or about 4.1m bpd excluding China. Of this, about 3m bpd is from petrochemical demand (eg plastics, textiles, fertilisers), 600k bpd from fuel oil and 500k bpd from jet fuel.
- US oil exports have increased by 2 million to 3 million bpd.
- Strategic petroleum reserves (SPR) are drawing down 2-3m bpd.
- There has been growth in other supply and commercial stock draw-downs
So if the starting point is a shortfall of 15 million to 16 million bpd (net of the flow through alternative pipelines), then the factors above are currently plugging that gap and can plausibly continue to do so for another two months.
China can probably sustain reduced demand for an extended period.
This means the key swing point would be the continued SPR draw-downs in other countries and US commercial stocks running too low.
If these factors reached a tipping point, the market would need higher prices to choke off another 3m bpd of demand, which would start getting into more price-inelastic areas like gasoline and diesel.
If anything, there are some short-term oil surpluses for now, since refiners are wary of bidding for product with the risk of a deal.
This has led to further falls in fuel prices.
For example jet fuel, having surged from US$90 to $US220 a barrel in the conflict’s initial stages, has fallen back below US$130.
AI themes
Two quarterly results in the US last week fuelled a broadening of the AI theme:
- Dell (+33%): The computer hardware-maker’s revenues were 23% above expectations and up 88% year-on-year, driven by AI-optimised server revenue (+757% yearly) to US$16 billion. Orders were 1.5x recognised revenue with the backlog rising faster than they could ship. AI customers were up 50% in six months. Supply remains constrained, particularly in memory. Guidance for FY27 is for 50% revenue growth. This highlights the demand from enterprise to upgrade infrastructure.
- Snowflake (+36%): The cloud-based platform, which helps organisations store, analyse and share massive amounts of data, had been caught up in the “SAASpocalypse”, falling 56% from November to April. It reported its second quarter of accelerating year/year revenues from 26% in Q3 CY25, to 30% in Q4 CY25 and now 34% in Q1 CY26, with net revenue retention (a measure which excludes new sales and indicates if existing customer base is growing or shrinking) of 126%. Customers using AI are looking to Snowflake for their intelligence layer – effectively a control plane across the AI agents. This supports the thesis that agents run on top of the Snowflake’s software rather than disintermediate their data warehouse. Snowflake guided to FY27 product revenue growth of 31% (up from 27%) and raised both margin and free cash flow margin guidance.
The key observation here is an acceleration of spending at both ends of the AI stack – in enterprise hardware (servers) and applications (software) – as companies position themselves to integrate AI.
This builds on recent comments from US network equipment maker Cisco Systems that enterprises need to invest in infrastructure to be in a position to use agentic AI.
Confidence in demand is increasing and there are supply constraints that help support margin for companies involved in the build-out of this hardware.

Find out about
Pendal Focus Australian Share Fund
Crispin Murray, Head of Equities
It’s still true that some software businesses facing structural threats, but the market is shifting away from treating the issue in an indiscriminate way.
This is helping underpin a rally in semiconductors – and now a broader rebound with the iShares Expanded Tech Software Sector ETF breaking back above its technical resistance level.
US data
Overall, data is signalling a US economy that is holding up well, underpinned by a resilient consumer and strong investment spending.
Inflation remains stubbornly high, but is not getting worse.
Inflation
The latest personal consumption expenditures (PCE) data – a measure of inflation – was in-line with expectations at a headline level and slightly below expectations on a core basis.
The core measure is still running at 3.3% year-on-year, with headline at 3.8%.
This print, combined with the fall in oil prices, helped two-year US Treasury yields drop 12 basis points.
The US Fed’s challenge is that the absolute number remains stubbornly high at above 3%, while its target is 2%.
There are reasons to believe the current inflation rate may be overstated, including:
- Some tariff effects remain
- There is a reasonable case that IT/software inflation is being materially overstated, due to AI spending and the subsequent uplift in product quality/value to customer not being reflected in pricing.
New Fed chair Kevin Warsh believes the trimmed mean PCE is a better measure of inflation that the Core. The former is running at 2.33%.
However even using this different perspective, inflation data is still running above target.
And when you look at the underlying components, goods are deteriorating – which reflects more-consolidated industries – while services are stable but have not yet begun to fall.
Given labour market trends are improving, and we are in an environment where inflation risk is perceived as being higher, it’s difficult to see how the Fed could make a case for easing.
Spending
US real disposable income and spending data suggest consumption is holding up well, despite some pressure on disposable income – and this is supported by a fall in the savings rate.
Consumption rose 0.1% monthly but prior months were revised up leading to the three-month number picking up.
Real wages were softer, which led to disposable income falling 0-0.5% month/month and -0.3% on a rolling three-month basis. The savings rate fell to 2.6%, its lowest point since December 2022.
This can be read two ways.
Either consumption is unsustainable, or other factors such as consumer wealth, expectation the fuel price shock will prove temporary, and confidence in employment are all underpinning consumer spending.
With recent falls in US petrol prices, there are some signs of relief supporting resilient consumer demand.
Australian economy
April’s CPI inflation data was better-than-expected at a headline level, prompting optimism that the RBA may not need to raise rates again. This drove a 9bp rally in the 2-year government bond.
- Headline CPI rose 0.4% month/month versus 0.6% expected. The annual rate was 4.2% versus 4.3% expected and 4.6% in March. This was helped by the drop in fuel excise.
- The trimmed-mean measure was 3.4%, in line with forecasts. Construction costs surprised to the upside, but international travel was less than forecast.
- The 3-month rate is decelerating marginally and may reflect a loosening of the labour market.
The issue for the RBA is that non-discretionary items (electricity, rents, insurance, education and health) is running at 5.1%. A number of these are structural, such as the impact of the housing shortage.
The RBA needs the economy to run below trend for a period and that probably equates to 1.5% GDP growth. The challenge is while the consumer may be slowing, data indicates the investment side of the economy is accelerating.
Household spending fell 1.1% month/month in April, below forecast, and is +4.9% year/year (versus 5.8% expected).
April’s drop-off came after two strong months and takes the underlying rate back to around 5% which was where it had been. The main cause was a fall in air travel due to the Iran war. The three-month run rate is at 3.6% annualised.
Offsetting this was a boom in investment spending. Private cap-ex spending rose 6.5% quarter/quarter versus 1.2% expected, driven by a surge in plant & equipment spending (+18% quarter/quarter, 31% year/year).
This was driven by non-mining sectors (+8.8%), specifically tech related spend (+96% quarter/quarter and 190% year/year) off the back of an acceleration in data centre spending. There was an offset in building and structures, down -3.8%.
The overall impact is hard to determine, as there is an offset in that at least 50% of data centre investment goes into imported items, although that component is back-ended.
So the net effect on GDP is not as it looks at face value. It is however estimated that investment could represent 40-50% of incremental GDP growth, which does put pressure on the RBA to slow other parts of the economy.
Markets
Markets remain well supported despite the fuel crisis.
Falling energy prices (for now) and lower bond yields help underpin what has been an earnings-driven rally in the US.
Anecdotes around AI investment remain supportive and the recovery in the software index adds breadth to the rally.
Falling oil and bond yields supported airlines and homebuilders last week.
Despite the rebound, overall sentiment does not look too stretched.
One issue to be mindful of is US equity supply; the combination of rising capex spend by US corporates will limit the rise in buy-backs.
At the same time an increase in IPOs, notably SpaceX, could provide a liquidity overhang, which may see some market consolidation.
The key threat to the market, in our view, would come from a softening outlook for AI spending and AI business models. That is not currently on the horizon.
The other would be a significant deterioration in the economy. This risk has diminished as the fuel shock has subsided.
The Australian market was strong last week, helped by inflation data easing concerns on rates and driving market rotation back to some of the more rate-sensitive sectors.
Discretionary stocks rose 4.6% and REITs 2.3%. We also saw tech stocks continuing to bounce, albeit nothing like what has been seen in the US. Banks continue to lag the market both for the week and the month.
The S&P/ASX 300 was up 1.3% for May.
The best-performing sectors were resources (+7.7%) and discretionary (+4.6%).
Healthcare (-8.9%) Utilities (-7.6%) and Energy (-6.0%) were the worst performers. Banks (-4.2%) also lagged.
From a stock perspective, smaller-cap names such as Megaport (MP1, +69.4%) and Sime (SGM, +29.7%) – where earnings are linked with AI demand – led the market.
Among the best-performing larger-cap names were miners (eg South32 (S32, +19.4%) BHP (BHP, +16.0%), rate-sensitives (eg Computershare (CPU, +14.6%) and fuel deflation beneficiaries (eg Qantas (QAN, +12.3%).
Among the worst performers were companies that downgraded earnings guidance, including Brambles (BXB, -26.8%), ASX (ASX, -24.05), CSL (CSL, -22.3%), Endeavour (EDV, -14.0%), Origin Energy (ORG, -10.2%).
Fuel-related names such as Viva Energy (VEA, -13.8%) and Woodside Energy (WDS, -8.6%) also underperformed.
About Crispin Murray and the Pendal Focus Australian Share Fund
Crispin Murray is Pendal’s Head of Equities. He has more than 27 years of investment experience and leads one of the largest equities teams in Australia. Crispin’s flagship Pendal Focus Australian Share Fund is a high-conviction equity fund with a two-decade track record across a range of market conditions.
Pendal is a global investment management business focused on delivering superior investment returns for our clients through active management.
Softer-than-expected inflation data for April has lifted hopes of a rate pause, even as services inflation stays stubbornly elevated. TIM HEXT breaks down the latest data release.
- Find out about Pendal Government Bond Fund
- Browse Pendal’s fixed interest funds
April inflation. Elevated but not accelerating.
THE ABS today released the April monthly CPI numbers. Prices compared to April 2025 (called year-on-year) were 4.2% higher, against expectations of 4.4%. This was lower than the 4.6% in March.

Non-seasonally adjusted prices were 0.4% higher than March, although closer to flat if adjusted (the ABS is still refining their seasonality for monthly numbers).
Trimmed mean inflation was 3.4% in the 12 months since April 2025, up slightly from 3.3% in March.
So overall it is fair to describe inflation as elevated but peaking.
The RBA in its recent forecast update expect headline inflation at 4.8% by the end of June and 4% by the end of the year. These may prove too high, barring new major Middle East disruptions.
What can we learn from the details?
A key focus for nearer term inflation is the so called second round impacts of fuel price increases. The RBA provided this useful graph in its recent Monetary Policy Statement:
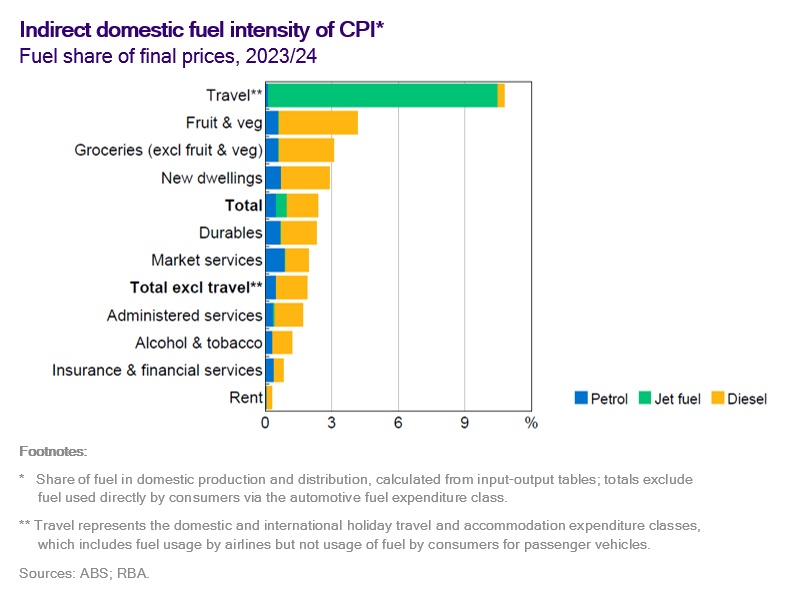
Apart from travel, the impact is limited but not zero. This was backed up by today’s numbers. Added to this, free transport in Victoria and now Tasmania (joining the 50 cent Queensland fares) saw urban transport fall by 20%.
In addition, the ABS recently did a survey of the impact of fuel increases on businesses. Nearly half have absorbed the costs, at least for now. These were the responses:

Housing and medical costs though remain worryingly elevated and leave us pessimistic that services overall will fall below 4% any time soon. For example, health insurance premiums averaged 4.4% higher in their April annual increase.
What does this mean for markets?
We get the Q2 inflation numbers in late July just ahead of the RBA meeting in August. For now, trimmed mean looks like being around 1%, following on from the Q1 result of 0.9%.
Clearly this is too high, but it would leave annual trimmed mean at 3.7%, slightly below the RBA forecast of 3.8%.
Uncertainty remains high for now courtesy of the Middle East. However, combined with the deteriorating employment and now housing outlook (post-budget) we think the RBA may be on hold for the remainder of the year.
Despite this week’s rally, with slightly less than one more hike priced in we think the bond market still offers some value.
Find out about
Pendal Government Bond Fund
Tim Hext, Head of Government Bond Strategies
If you’d like to hear more about how Pendal’s Income & Fixed Interest team is positioning for this environment, please contact us through our accounts team
About Tim Hext and Pendal’s Income & Fixed Interest boutique
Tim Hext is a Pendal portfolio manager and head of government bond strategies in our Income and Fixed Interest team.
Tim has extensive experience in banking, financial markets and funding including senior positions with NSW Treasury Corporation (TCorp), Westpac Treasury, Commonwealth Bank of Australia, Deutsche Bank, Bain & Co and Swiss Bank Corporation.
Pendal’s Income and Fixed Interest boutique is one of the most experienced and well-regarded fixed income teams in Australia.
Find out more about Pendal’s fixed interest strategies here
About Pendal
Pendal is a global investment management business focused on delivering superior investment returns for our clients through active management.
In 2023, Pendal became part of Perpetual Limited (ASX:PPT), bringing together two of Australia’s most respected active asset management brands to create a global leader in multi-boutique asset management with autonomous, world-class investment capabilities and a growing leadership position in ESG.
Get to know CHRIS LEES, a London-based senior portfolio manager with our affiliate asset manager J O Hambro
ALONG with Nudgem Richyal, Chris is a co-portfolio manager of Pendal Global Select Fund.
J O Hambro is an equities specialist asset manager with international capabilities across Global and International, UK, Europe, Asia and emerging markets.
The Pendal Global Select Fund offers access to a professionally managed portfolio of global shares and the potential for long-term capital growth.
Pendal and J O Hambro are part of Perpetual Group.
In this video, Chris discusses the team’s approach to portfolio management and how they screen new investments.
Learn more about Pendal Global Select Fund: https://pendalgroup.com/global-equities/pendal-global-select-fund
Highlights:
0.37 What type of investor has the fund been designed for?
1.17 How do you approach portfolio management?
1.57 How do you screen new investments?
Find out about
Pendal Global
Select Fund
Chris Lees & Nudgem Richyal,
Senior Fund Managers
About Chris Lees and Nudgem Richyal
Chris Lees and Nudgem Richyal are senior fund managers of Pendal Global Select Fund. The pair have been working together as investment managers for more than 20 years.
Chris has more than 32 years of investment industry experience. He joined Pendal Group’s UK-based asset manager J O Hambro Capital Management (JOHCM) in 2008 after spending 19 years at Baring Asset Management, ultimately as head of its global sector team.
Nudgem has 22 years of industry experience, joining JOHCM with Chris in 2008. He was previously an investment director with the Global Equity Group of Baring Asset Management, where he worked closely with Chris since 2001.
Unlike green bonds, social bonds fund outcomes that are harder to define, track and compare – which makes rigorous impact reporting both more complex and more important. Pendal sustainable finance and impact investing director MURRAY ACKMAN explains
- Social outcomes vary widely across projects
- Actual outcomes matter more than projections
- Learn more about Regnan Credit Impact Trust
Collecting impact data for social bonds is inherently more challenging than for green bonds, and this is particularly evident when reporting outcomes for Regnan Credit Impact Trust.
Green bonds tend to finance projects with relatively fungible and comparable outcomes.
Whether funding a wind farm in Australia or Europe, the underlying metrics are well established: installed capacity, electricity generated, and emissions avoided.
These outcomes are physical, annualised and repeatable.
Issuers are generally able to report them in a consistent and comparable format over time. The link between capital deployed and environmental outcome is relatively direct.
Social bonds operate very differently.
They finance a wide and diverse set of activities, ranging from social housing and healthcare to education, financial inclusion and food security.
These projects are highly context specific and often target different populations, geographies and social needs.
As a result, the indicators used to report social impact vary significantly between issuers and even between projects within the same bond program.
While international frameworks[1] encourage transparency and standardisation, they also recognise that social outcomes are harder to define, measure and aggregate in a consistent way.
In practice, issuers may report qualitative outcomes, high level beneficiary counts, or indicators that are not reported at the granularity required for portfolio level aggregation.
In some cases, data is disclosed at an issuer or program level rather than being clearly attributable to a specific bond.

Find out about
Regnan Credit Impact Trust
George Bishay, Head of Credit and Sustainable Strategies
Engagement helps close social reporting gaps
Addressing these gaps is an ongoing part of our engagement with issuers, particularly where reporting practices are still evolving.
A further challenge is the distinction between projected and actual impact. For many social projects, outcomes take years to materialise.
A training program aimed at improving access to finance for rural women, for example, may have long term benefits that cannot be quantified in the early years of a bond’s life.
Unlike a physical asset, social change is rarely linear or immediate.
For this reason, the funds take a deliberately conservative approach to outcome reporting.
We report only outcomes that we know have occurred, based on actual data rather than projections.
This ensures that clients can clearly see what their capital has contributed to in practice, even if the full social value created extends beyond what can be captured on a calculator.
Where impact cannot yet be quantified, it remains very real and continues to inform both our investment decisions and our ongoing engagement with issuers.
Below is a list of bonds that include social projects.

Source: Pendal
[1] International Capital Market Association
About Murray Ackman and Pendal’s Income and Fixed Interest boutique
Sustainable finance and impact investing director Murray Ackman joined Pendal in 2020 to provide fundamental credit analysis and integrate Environmental, Social and Governance factors across credit funds.
Murray has worked as a consultant measuring ESG for family offices and private equity firms and was a Research Fellow at the Institute for Economics and Peace where he led research on the United Nations Sustainable Development Goals.
Pendal’s Income and Fixed Interest boutique is one of the most experienced and well-regarded fixed income teams in Australia. In 2020 the team won the Australian Fixed Interest category in the Zenith awards.
Regnan Credit Impact Trust is a defensive investment strategy that puts capital to work for positive change
Pendal Sustainable Australian Fixed Interest Fund is an Aussie bond fund that aims to outperform its benchmark while targeting environmental and social outcomes via a portion of its holdings.
The Federal Budget’s proposed changes would reduce the after-tax appeal of investing in established residential property, argues Pendal’s JULIA FORREST.
- CGT discount replaced; indexation plus 30 per cent floor
- Negative gearing removed for new existing-home investors
- Find out more about the Pendal Property Securities Fund
THE Federal Budget’s 2026 package targets two of the biggest tax settings underpinning residential property investment – negative gearing and the capital gains tax (CGT) discount – in a bid to shift investor demand away from established dwellings and toward new housing supply.
The negative gearing change is proposed to apply to purchases of existing residential property where the contract is entered into after 7:30pm on 12 May 2026. The CGT changes are proposed to apply from 1 July 2027, giving the market a lead time that could influence investor behaviour well before the start date.
What’s changing
Under the proposal, negative gearing concessions would be withdrawn for investors buying existing residential property from 7:30pm on 12 May 2026. Existing negatively geared investments in residential property are expected to be grandfathered until disposal.
From 1 July 2027, the long‑running 50 per cent CGT discount would be replaced with an inflation indexation approach, so tax is levied on real gains, with a minimum 30 per cent tax rate payable.
Residential property investments held at 1 July 2027 and sold after that time will have the gain that accrued up to 1 July 2027 treated under the 50 per cent CGT discount method and the gain that accrued after that time to the date of sale will be treated under the indexation method.
The 30 per cent minimum tax would apply to the indexed gain.
For investments in new residential properties from 1 July 2027, investors will be able to choose either the 50 per cent CGT discount, or the indexation method with the minimum tax 30 per cent tax rate.

Find out about
Pendal Property Securities Fund
Julia Forrest, Portfolio Manager
How it may hit investor returns – and prices
By reducing the after‑tax value of losses and capital gains, the Budget proposals lowers what an investor will rationally pay for established stock.
“As an incoming purchaser will not benefit from the preferential tax treatment it is possible this will be reflected in a lower price paid,” says Julia Forrest, co-portfolio manager of Pendal Property Securities Fund.
“Treasury estimates house price growth to be 2 per cent lower as a result.”
A likely behavioural response, according to Forrest, is a tilt toward longer holding periods, particularly where investors aim to spread transaction costs and the new CGT settings across a longer timeframe.
Winners and losers: New supply in focus
While the negative gearing changes only apply to existing residential property and won’t impact other asset classes, the CGT changes apply to all investments.
Forrest says the minimum 30 per cent CGT tax rate on indexed capital gains may work in favour of dividend stocks over growth stocks.
Meanwhile, the favourable tax treatment benefit for new residential property that genuinely adds to supply should support residential property developers.
“The new rules redirect investor capital away from established property. We note that only 5 per cent of new investor lending finances new builds so this may change the flow of credit,” explains Forrest.
“The changes genuinely seek to increase the supply of housing which ultimately is a positive outcome.
“However, slower house price growth may impact discretionary spending, with the lower wealth effect.”
Forrest says the Pendal Property Security Fund is weighted towards residential developers of affordable dwellings, land lease developers and non-discretionary retail and malls.
About Julia Forrest and Pendal Property Securities Fund
Julia Forrest is a portfolio manager with Pendal’s Australian Equities team. Julia has managed Pendal’s property trust portfolios for more than a decade and has 25 years of experience in equities research and advisory, initial public offerings and capital raisings.
Pendal Property Securities Fund invests mainly in Australian listed property securities including listed property trusts, developers and infrastructure investments.
About Pendal Group
Pendal is an Australian investment management business focused on delivering superior investment returns for our clients through active management.
Australia’s AI moment is arriving – and the data centre build-out is the tell. Pendal Smaller Companies Fund portfolio manager PATRICK TEODOROWSKI outlines what is driving the surge and where the opportunities are emerging
- Data centre builds surge in Australia
- Small caps, copper and uranium stand out
- Find out about the Pendal Smaller Companies Fund
THE boost in growth and investment from the large hyperscalers in the US has been evident for some time, but in just the past couple of weeks, two data centre providers alone have announced 50 per cent growth in Australian data centre capacity.
NextDC (ASX:NXT) announced a 250-megawatt contract, with a planned capex spend of $4 billion in 2027, and CDC Data Centres secured Australia’s largest ever data centre contract – a 555-megawatt deal, also with a planned $4 billion capex spend in 2027.
Morgan Stanley estimates around $8-10 billion in data centre capex will be spent out to the end of the decade, but Pendal Smaller Companies Fund portfolio manager Patrick Teodorowski believes that the actual amount could be materially higher.
“We think they’ve massively underestimated the amount of spend that’s happening,” Teodorowski says.
Pendal research estimates that up to $100 billion in data centre capex will be rolled out between 2026 and 2030.
“If you average that out, it’s $25 billion per annum that needs to be spent for them to meet those targets,” explains Teodorowski.
The Australian data centre market is tipped to reach 3,700 megawatts by 2030.
“The surge in growth and investment from the large hyperscalers out of the US is going to go from about a quarter of a trillion dollars a year to over a trillion dollars, and it feels like finally Australia is going to join the party,” says Teodorowski.
“This is something you have to pay attention to. This is going to throw up a lot of investment opportunity.”
The biggest components of a data centre build are the electrical and cooling.
“Sixty to 80 per cent of the site capital expenditure is actually on electrification and cooling, and we think we’ve found some interesting opportunities that will benefit from that,” says Teodorowski.
Where small caps can plug into the build-out
One of those opportunities is commercial construction company Shape (ASX:SHA), which provides fit-outs, remedials and new build solutions.
Historically Shape had a large presence in the office space, but the company has now won a number of data centre fit-out contracts.
For one of the company’s builds, Shape subcontracted Southern Cross Electrical (ASX:SXE).
“Southern Cross Electrical does about $150 million of revenue per annum. The company is seeing an immediate opportunity pipeline of up to a billion dollars,” notes Teodorowski.
“So today it’s about 15 to 20 per cent of their business, but we can see that growing significantly and being the primary driver for their growth over the next three years.”
Another small cap catching the tailwinds of the AI capex explosion is NRW Holdings (ASX:NWH) thanks to its acquisition of electrical and mechanical contractor Fredon about a year ago.
“About a third of their business is within data centres, and they’ve recently made some announcements. They’re building data centres for the Australian Defence Force at a number of sites across Australia, and they also build for the private sector as well,” says Teodorowski.
Pendal Smaller Companies Fund holds a position in SHA, SXE and NWH.
Copper and uranium in focus
The rapid rise of data centres will, in turn, also significantly increase power demand.
Some analysts estimate power demand across the US will double from 6 per cent to 12 per cent over the next five years.
Teodorowski sees similar growth in Australia. Alongside that is the necessary network to support that surge in power demand. That’s where copper becomes a big part of the story.
Copper demand is forecast to grow more than 50 per cent over the next 10 to 15 years at the same time production is heading in the opposite direction.
“Growing copper production has been something that’s been very troublesome over the last decade,” explains Teodorowski.
“This year, I think the forecast is for declining copper production, and the number of large-scale discoveries has been in decline for decades. So we think it’s a very good setup for that commodity.”
This means producers like Capstone Copper (ASX:CSC) and Develop Global (ASX:DVP), and small caps with high-grade projects of significance like Firefly Metals (ASX:FFM), will likely be among the beneficiaries of this thematic.
The push for cleaner baseload power is also driving an increase in commodities like uranium, particularly across the US where several major tech companies are sourcing clean energy to power their operations.
Microsoft agreed to spend US$1.6 billion for a 20-year supply of power from the restarted Three Mile Island nuclear power facility. Meta, meanwhile, inked a 20-year power deal with Constellation for its data centres, and Amazon has agreed to buy up to 1,920 megawatts of nuclear power from Talen.
This is set to benefit companies like Paladin Energy (ASX:PDN) – the largest ASX-listed uranium producer, Nexgen (ASX:NXG), which owns the largest undeveloped global uranium deposit, and emerging producer Bannerman Energy (ASX:BNM).
Pendal Smaller Companies Fund holds a position in CSC, DVP, FFM, PDN, NXG and BNM.

Find out about
Pendal Smaller Companies Fund
Patrick Teodorowski & Lewis Edgley,
Portfolio Managers
About Lewis Edgley and Patrick Teodorowski
Lewis and Patrick are co-managers of Pendal Smaller Companies Fund.
Portfolio manager Lewis Edgley co-manages Pendal’s Australian smaller companies and micro-cap funds and conducts analysis on a range of smaller companies. He joined the Pendal Smaller Companies team in 2013 as an analyst, before being promoted to the role of portfolio manager in 2018. Lewis brings 20 years of industry experience with previous roles spanning equities research, as well as commercial and investment banking roles at Westpac and Commonwealth Bank.
Portfolio manager Patrick Teodorowski co-manages Pendal’s smaller companies and micro-cap funds and conducts analysis on a range of smaller companies. He joined Pendal in 2005 and developed his career as a highly regarded small cap analyst. Patrick holds a Bachelor of Commerce (1st class Honours) from the University of Queensland and is a CFA Charterholder.
About Pendal Smaller Companies Fund
Pendal Smaller Companies Fund is an actively managed portfolio investing in ASX and NZX-listed companies outside the top 100. Co-managers Lewis Edgley and Patrick Teodorowski look for companies they believe are trading below their assessed valuation and are expected to grow profit quickly. Lewis and Patrick together have more than 40 years of investment experience.
Find out about Pendal Smaller Companies Fund
Find out about Pendal MicroCap Opportunities Fund
Find out about Pendal MidCap Fund
About Pendal Group
Pendal is a global investment management business focused on delivering superior investment returns through active management.
In 2023, Pendal became part of Perpetual Limited (ASX:PPT), bringing together two of Australia’s most respected active asset management brands.
Here are the main factors driving the ASX this week according to Pendal portfolio manager JIM TAYLOR. Reported by portfolio specialist Chris Adams
THE key building blocks of the positive investment backdrop remain in place.
First, the US labour market continues to hold up very well, with minimal signs of AI disruption leading to job shedding.
Second, April retail sales suggest the consumer remains resilient with tax refunds bolstering economic activity.
Absent the Iran conflict, it is highly likely we would have been upgrading economic growth on the back of consumer strength, the uptick in manufacturing, and the stimulus from AI spending.
The main dark cloud is the prospect of higher inflation as surging energy prices flow into the far corners of the economy.
An incredibly strong 1Q26 US reporting season – where earnings grew 28% – reflects the strength of underlying activity and the commensurate ability of corporates to pass through higher costs into the consumer base.
The hottish US producer price index (PPI) data last week partially undermined the positive narrative and saw the market shift to expectations towards an interest rate hike over the course of the year. US 10-year bond yields rose 23 basis points (bps), while the S&P 500 gained 0.2%.
Domestically, the budget was well flagged but does have the possibility of stifling housing activity. On an economy-wide perspective, this could overwhelm the benefits to the first homebuyers the government is attempting to assist. The S&P/ASX 300 was off 1.2% for the week.
US President Donald Trump’s visit to Chinese President Xi Jinping has come and gone with pronouncements on Boeing sales, a Board of Trade and Investments, and some additional agricultural and energy purchases. But there was nothing conclusive on Nvidia chips and a resolution to the Middle East standoff.
Trump is contending with approval ratings among Republicans at all-time lows, on the back of a foreign war and rising domestic inflation.
It is hard to see his Administration allowing the current situation to drag on; it feels like something needs to give in the near-term. At the moment rising yields, rate expectations and the oil price move all point to a market that expects hostilities with Iran to renew now that Trump is back in the US.
Macro and policy US
Inflation
The consumer price index (CPI) rose 0.64% month/month in April, versus +0.87% in March and a median forecast of +0.60%. The Core measure was +0.38% for April, versus a median forecast of +0.3% and a 0.20% gain in March.
On an annual basis, the CPI was +3.81% for April, up from +3.26% in March. Core was +2.75% year/year, a touch ahead of the median forecast (+2.70%) and up from +2.60% in March.
The three-month annualised CPI has dipped below the Fed’s 2% target a few times, but the six-month annualised and the 12-month rate never got there – and are now rising again on the back of energy prices and cost-pass through.
The greater surprise was in PPI, where headline rose 1.4% month/month in April well ahead of the +0.5% consensus expectation. It is at +6.0% year/year.
The Core measure rose 1.0%, up from +0.2% in March, the largest gain since March 2022 on the back of a concentrated energy price shock. Consensus was expecting +0.3%. It is at +5.2% year/year.
April’s rise was also driven by a 0.7% rise in the core goods prices component and +1.2% in prices for services, excluding trade services. Transportation and warehousing services prices jumped by 5.0%.
Trade services prices, which reflects the difference between the cost for distributors to buy goods and the price they charge to customers, rose 2.7% in April. Retailers seem to have been able to take advantage of consumer strength, driven in turn by tax refunds.
The big question is whether this is a material, one-off step-up in the PPI – or the start of a sequence of big increases.
Retail sales
Headline retail sales rose by 0.5% (+0.7% ex-autos) in April, in line with the consensus.
February and March sales – already strong – were also revised up a further 0.2% and demonstrate consumer resilience despite the energy shock.
There was a 0.8% gain in food and beverage sales, driven mainly by higher prices.
However non-store sales rose 1.1%, also driving the headline gain, but suggesting demand also remains strong given that consumer prices for core goods ex-autos didn’t change much last month.
Individual income tax refunds in April were US$22 billion higher than in the same month last year. This is equivalent to roughly 3% of monthly retail sales. That said the rise in total spending on gasoline is estimated to be only slightly less.
Tax refunds are likely to fall away sharply after May, meaning that the consumer loses the buffer against higher energy prices. The market will be focused on consumer activity levels from here.
The Fed
Boston Fed President Susan Collins said that while she still expects inflation linked to the conflict to subside – and that underlying inflation was still heading lower – “the probability around that has declined”.
She noted that there were other “less benign” scenarios that would require rate hikes.
She is watching:
- Most importantly, households’ and businesses’ expectations of future inflation, which have drifted to the high end of their historical range.
- Whether price pressures spread beyond energy to other goods and services.
- The extent to which tariffs continue to pass through the price chain.
Wages aren’t a significant source of inflation, she said.
Macro and policy Australia
The Federal budget flagged more spending on defence and public hospitals, funded largely by changes to the NDIS.
It was interesting to note on the revenue side that a material amount of projections (~$15 billion between FY26 and FY30) is assigned to “decisions taken but not yet announced and not for publication”, suggesting a new policy waits in the wings.
There is risk of unintended consequences from the proposed changes to capital gains tax and negative gearing – potentially from first home buyers being crowded out of new builds by investors and/or reduced renovation and remodelling activity from lower turnover in investment properties.
We saw how policy changes can have unintended effects in Victoria, where increased land tax rates, taxes on vacant homes and windfall gains, increased stamp duties and the short stay accommodation levy resulted in material declines in confidence and activity levels in the state’s property sector.
Investors have been the key driver of accelerating bank sector mortgage growth. New investor loan commitments for purchases of established and new dwellings fell in the quarter, while growth slowed for dwelling construction.
With interest rates higher and changes to CGT and negative gearing announced, investor loan commitments are likely to fall in the coming months, sharpening focus around the outlook for banks.
Find out about
Pendal Focus Australian Share Fund
Crispin Murray, Head of Equities
Markets
US earnings
US Q1 earnings season observations:
- The blended earnings growth rate for Q1 S&P 500 earnings per share (EPS) currently stands at 27.7%, versus 13.2% expected at the end of the quarter.
- The blended revenue growth rate is 11.4%.
- 91% of S&P 500 companies have reported, with 84% beating consensus EPS expectations (the one-year average is 79% and five-year is 78%.)
- 80% have surpassed consensus sales expectations (73% one-year average and 70% five-year.)
- In aggregate, earnings are 17.9% above expectations, above the 7.2% one-year average positive surprise rate and the five-year average of 7.3%.
- In aggregate, sales are 1.8% above expectations, above the 1.6% one-year positive surprise rate but below the five-year average of 2.0%.
Much of the recent US equity market momentum has corresponded with surging near-term earnings estimates.
Bottom-up consensus estimates for S&P 500 EPS in 2026 and 2027 have each risen by 8% YTD.
That said, increasing expectations for AI capex spending and higher energy prices have driven the majority of the positive revisions. Excluding AI infrastructure and Energy companies, S&P 500 2027 EPS estimates have been flat YTD.
In small caps, the median stock in the Russell 3000 is delivering 10% EPS growth – the strongest rate in four years.
EPS revision breadth during the past month has been positive in every S&P 500 sector. The sectors and stocks with the strongest earnings revisions have generally outperformed.
Australian bank reporting and updates
Bank reporting season flagged a couple of things worth thinking about.
There was a surprising decline in sequential revenue growth rates from the December 2025 quarter to the March 2026 quarter.
In February the banks reported strong revenue growth and benign credit issues resulting in ~4-6% EPS upgrades.
In the recent crop of updates the revenue line weakened, asset quality turned down and the banks began rebuilding collective provisions.
This has now fully unwound the EPS upgrades from the Feb 2026 reporting season.
About Jim Taylor and Pendal Focus Australian Share Fund
Drawing on more than 25 years of experience investing in top-performing Australian companies and a background in accounting, Jim manages our Long/Short Fund and co-manages our Imputation Fund. He is a Chartered Accountant with membership of the Australian Institute of Chartered Accountants.
Pendal Focus Australian Share Fund is managed by Crispin Murray. The fund has beaten its benchmark in 14 years of its 18-year history (after fees), across a range of market conditions.
Find out more about Pendal Focus Australian Share Fund here.
Pendal is an independent, global investment management business focused on delivering superior investment returns for our clients through active management.
MTR Corporation’s inaugural green bond is mobilising capital to scale low-carbon transport and energy smart urban infrastructure.
- MTR green bond funds low-carbon transport
- Proceeds support rail upgrades, renewables, resilience
- Find out more about Pendal’s Responsible Investing capabilities
Regnan Credit Impact Trust and Pendal Sustainable Australian Fixed Interest Fund invested in MTR Corporation’s inaugural green bond, which directs proceeds toward a portfolio of low‑carbon transport and energy‑efficient urban infrastructure.
MTR is recognised as a global leader in electrified mass transit, carrying around 6.5 million passenger journeys each week across its networks, including in the Sydney and Melbourne metros.
The green bond finances and refinances eligible green investments under MTR’s Sustainable Finance Framework, with proceeds expected to support a range of climate‑aligned projects.
This includes major rail line extensions in Hong Kong, station energy‑efficiency upgrades, low‑carbon building improvements, renewable energy installations, biodiversity and conservation initiatives, and climate‑resilience works.
Several near‑term projects are likely to be funded through this issuance, including rail expansion programs that increase public transport capacity in new growth districts, replacement of older rolling stock and equipment with more efficient alternatives, and upgrades to station infrastructure aimed at reducing operational energy use.
The bond may also finance enhancements to MTR’s extensive property portfolio, where the company is targeting substantial reductions in scope 1 and 2 emissions intensity by 2030, as well as water and waste‑management improvements across its network.
This bond is significant as it supports one of the world’s most heavily used public transport systems, where scale magnifies climate benefits.
Hong Kong relies on public transport for roughly 11.7 million trips per day, and rail accounts for around 44 per cent of domestic journeys.
Improvements funded through this green bond help avoid emissions by shifting more commuters onto efficient rail networks, reducing road congestion, and accelerating energy‑efficiency gains across MTR’s operations.
These projects contribute to MTR’s science‑based targets, which include reducing well‑to‑wheel rail transport emissions by 46.2 per cent per passenger‑kilometre by 2030 and achieving carbon neutrality by 2050.
Source: https://www.mtr.com.hk/sustainability/assets/pdf/en/2024/MTR_Sustainable_Finance_Rpt_2024.pdf

Find out about
Pendal Sustainable
Australian Fixed Interest Fund
George Bishay, Head of Credit and Sustainable Strategies
About George Bishay and Pendal
George Bishay is Pendal’s head of credit and sustainable strategies. George’s investment management career spans over 30 years with Pendal and its predecessor firms.
He has also worked across numerous fixed income, credit and money market portfolios in portfolio management, credit analysis and dealing roles for 27 years.
In 2019 George was awarded the Alpha Manager status by Money Management publisher FE fundinfo.
Find out more about Pendal’s fixed interest strategies here
Pendal is an Australia-based investment management business focused on delivering superior returns for our clients through active management.
Pendal funds have backed one of ANZ’s SDG bonds – fast-tracking finance into clean energy, climate and social-impact projects.
- ANZ bonds back climate and social outcomes
- Two thirds of funding directed to Australia
- Find out more about Pendal’s Responsible Investing capabilities
Regnan Credit Impact Trust and Pendal Sustainable Australian Fixed Interest Fund invested in the ANZ Banking Group’s Sustainable Development Goals (SDG) Bond 2031, which allocates proceeds toward a diversified portfolio of social and environmental lending activities aligned with the United Nations SDGs.
Proceeds from ANZ’s SDG bonds are used to fund or refinance eligible assets with a strong emphasis on climate action, sustainable cities, clean energy and positive social outcomes.
The bond finances a broad range of projects, with approximately 80 per cent of proceeds allocated to environmental activities and around 20 per cent to social outcomes.
Around two thirds of funding has been directed to projects based in Australia.
On the environmental side, the bond supports the financing of more than 360 large scale renewable energy projects across Australia, India, Hong Kong and other regions. These include wind farms, solar projects and battery energy storage systems.
One example is the development, construction and operation of the 252-megawatt Wambo Stage I and 254-megawatt Wambo Stage II wind farms in south-east Queensland.
Examples of social projects supported include the operation of specialist disability accommodation across Australia, comprising nearly 1,000 beds, as well as the construction of a further 106 specialist disability accommodation homes providing around 350 beds.
The bond has also supported the delivery of more than 1,200 dwellings to be used as social and affordable housing. Investing in an ANZ SDG bond provides exposure to a high-quality Australian bank while directing capital toward a wide range of activities that support climate stability, social inclusion and sustainable economic development.
Source: https://www.anz.com/content/dam/anzcom/debtinvestors/sdg-bond-impact-report-september-2025.pdf
Find out about
Regnan Credit Impact Trust
George Bishay, Head of Credit and Sustainable Strategies
About George Bishay and Pendal
George Bishay is Pendal’s head of credit and sustainable strategies. George’s investment management career spans over 30 years with Pendal and its predecessor firms.
He has also worked across numerous fixed income, credit and money market portfolios in portfolio management, credit analysis and dealing roles for 27 years.
In 2019 George was awarded the Alpha Manager status by Money Management publisher FE fundinfo.
Find out more about Pendal’s fixed interest strategies here
Pendal is an Australia-based investment management business focused on delivering superior returns for our clients through active management.