Ashley Pittard, Head of Global Equities at Pendal recently presented his thoughts on the extent of risk that has developed in global equity markets at the Portfolio Construction Forum’s Strategies Conference 2019 – “20/20 Vision” . This article outlines the insights shared around why investors need to adopt a different mindset when it comes to investing in global equities in the 2020s.
Today global equities investors are facing into markets where the risks go well beyond trade wars and currency tantrums.
I’m proud of the first quartile performance Pendal’s Concentrated Global Share Fund has achieved since we commenced.
But it’s now more important than ever for investment managers in the global equities sector to have the right active strategy for the 2020s.
The extreme risk in global equities right now requires a different mindset as we enter the new decade.
September 15 marks the 11th anniversary of the Lehman bankruptcy and Global Financial Crisis (GFC).
That event sparked one of the greatest credit and equity bull markets in history as central banks adopted extreme and unprecedented monetary policies.
Along with conventional monetary policy actions including 735 interest rate cuts around the world, central banks took unconventional actions such as $US13 trillion worth of quantitative easing which essentially refers to “printing money”, preventing debt default and deflation.
End of the post-GFC era
Over the past ten years broad investment in global equities has been a great investment decision.
Investing in an index fund, exchange traded fund or a growth theme such as tech stocks would have done very well for your retirement savings instead of holding money in the bank.
After the GFC investors benefited from tail winds that drove share prices higher – such as falling interest rates, lower volatility, a declining Australian dollar and quantitative easing.
But that’s now changing.
The 2020s will be very different to the past decade.
In the new environment investors will need to be very selective rather than pursuing broad market exposure for their portfolios.
Macro supports such as cheap money and big government balance sheets won’t provide a blanket for all listed companies.
At Pendal we are contrarian, long-term fundamental stock pickers when it comes to global equities — so this environment plays to our strengths.
Markets in the new phase
Why am I so confident that these 10-year tail winds will become headwinds – even when volatility measures suggest risk is low in global equities?
It’s a hard ask for market valuations to be compelling when the market is trading at all-time highs. Price-to-Earnings ratios are over 17x and the S&P500 Index has grown to nearly four times its value since its GFC lows.
Bifurcation in the market is extreme and distortions are occurring within equity markets. We have a handful of mega cap technology-related stocks that have carried the market higher, while at the other end of the spectrum sectors deemed to be eternally disrupted have languished.
Growth sectors are significantly over-valued on traditional historical measures while value sectors are shunned.
This year just 6 % of the MSCI World Index stocks have accounted for 53% of the return for the global equity index.
Meanwhile, interest rates are down a long way. We have had 29 cuts from central banks in 2019 and government bond yields for the largest economies are at a 120-year low.
It is hard to say they will be going significantly lower. Consider the US 10-year bond as a proxy. In 2012 when the market believed the euro would break up and European banks would be nationalised, the US 10-year bond touched 1.36%. In 2016 when the ‘Brexit’ vote occurred, it touched 1.36%. In August it has drifted past the 1.75% level.
The Aussie dollar has collapsed from $1.10 over the last decade to hover around the US$0.70 level within a small range. Currency volatility for the major economies is at the lowest level since 1992.
But we have just started to see the US officially label China a currency manipulator.
It is timely to recall the 1995 Plaza Accord, a joint-agreement between France, West Germany, Japan, the United States and the United Kingdom, to depreciate the US dollar in relation to the
Japanese yen and German Deutsche Mark by intervening in currency markets. This event turned currencies upside down at the time and placed Japan into its lost decade. This event turned currencies upside down at the time and placed Japan into its lost decade.
It’s interesting that many economists saw this accord as a direct response from the US to the threat from Japan’s growing status as an economic superpower.
In my view equity risk is the highest in more than 20 years – regardless of what traditional volatility measures suggest.
When you have $US13.7 trillion of negative yielding debt globally investors have been pushed up the risk curve to chase ever decreasing yields.
And when you fundamentally change the value of cash massive distortions occur. We are seeing this on many levels.
Global debt is now 3.2 times the size of global GDP – again at an all-time high.
We have been here before
The tech sector – especially the FAANGs (Facebook, Amazon, Apple, Netflix and Google)- have been the darlings of the bull market for the last 10 years.
Real estate and utilities stocks have also been drivers of market returns, thanks largely to declining interest rates.
But the elephant in the room is the tech sector.
It has tripled its index weight since the GFC and doubled its index weight in the US market over the past five years.
Tech has been at the epicentre of this self-fulfilling circle — declining interest rates, exploding debt and rampant passive investing have helped to triple its representation of the market.
No doubt these are great businesses but it’s amazing how big their market capitalisations are — especially when compared to the GDP of some countries.
If we use the 2000 technology bubble as another proof point, the valuations again are stark.
It’s uncanny how AOL at its peak traded at similar levels to Netflix today.
Look at the metrics on the right hand side of this graph:
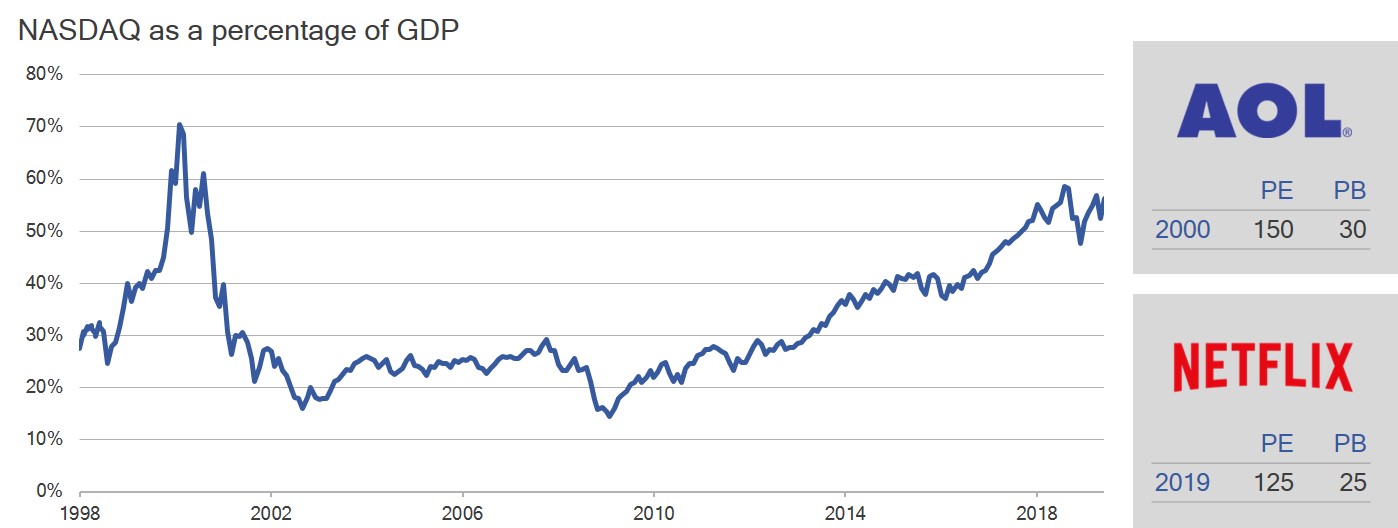
* Source: Bloomberg, Pendal. PE refers to price-earnings ratio, PB refers to price-book ratio.
You could argue about the relevance of using a price-book ratio for these tech names but as a long term valuation tool across different sectors, price-book is still a clean gauge of value.
And Nasdaq as a percentage of GDP is near historical bubble levels.
The extreme size of valuation premiums is a key risk driver.
Passively fulfilling a virtuous cycle
Here’s another aspect of the self-fulfilling circle. Passive and index-hugging strategies are reinforcing these valuation trends.
Over the past 10 years $US4.1 trillion has gone into passive investment funds versus outflows of $US1.5 trillion out of active.
In the year-to-date we have seen 65% of stocks in the MSCI World proceed into bear markets as passive inflows top $US7.4 billion and outflows from active strategies top $US22.4 billion.
The issue here is index and traditional strategies — by their inherent design — see more and more investors bet on higher growth for what has already risen.
This creates distortions in the market as passive ETFs focus on the largest companies in a sector, not the best companies.
Why we’re different
At Pendal, we are clearly very different.
We don’t look at the largest companies — just the best companies.
We focus on leading number one or number two franchises in their space when they are out of favour — regardless of size.
That is the lowest cost producer if it’s a commodity or largest market share if it’s a bank. We like monopoly assets.
We look at industries horizontally — not vertically as do many traditional index strategies.
We focus on fewer higher quality businesses and build a deep understanding of them like a business owner would.
We launched our Concentrated Global Share Fund three years ago and we have been very happy with the 1st quartile performance over the three-year period which reflects this very different approach compared to passive index following strategies.
Our philosophy and process has been the same since I started at BT Australia (the former entity name of Pendal) more than 20 years ago.
We have a universe of about 500 leading businesses that we follow.
We spend a lot of time focusing on disruption in industries. Usually we are buying businesses when we think they are cyclically depressed — while the market may think they are structurally impaired.
In our experience, only 15-20% of the market is attractive at any point in time. 
You need to be very selective to grow wealth over the long term. Our top 10 holdings (see table) are very different to the index. We have a very large active positions.
We hold specific industry leaders such as Anheisser Busch Inbev – a leader in the beverage market.
We hold Colgate – makers of toothpaste around the world. We hold Total – Europe’s leader in oil and gas production.
We don’t hold these companies because they’re included in the Index or have driven returns. We hold them for very different reasons.
Consider the recent Amazon Wholefoods acquisition as an example.
The consumer staples sector shows how we like to research, stay patient and use disruption to our advantage.
We focus on the best businesses, understand fundamentally how they work, then stay patient and wait until they are out of favour.
There is no doubt the Amazon Wholefoods deal will change food distribution globally.
As a result of this disruption the market discounted the sector as they questioned the brand value longer term post the deal.
We looked at the industry differently and focused on market share and their return on investment (ROI).
It was clear you only wanted to focus on P&G and Colgate with greater than 60% market share and 100% ROI.
We never wanted to own Kraft Heinz, Campbell soup or Kellogg’s due to their lower market shares — even though they were larger in the index.

Think differently to drive different results
Overall I believe you need to think differently, have a concentrated highly active and very selective stock picking approach,
Think like an owner in a group of #1 unique premium assets, be patient on valuation and get paid a dividend to wait while the business normalises.
This will serve you well as we enter the next decade.

Engaging via social media has become an essential part of daily lives for people the world over. The deeply entrenched use of smart phones and other mobile devices has superseded the traditional computers experience for an increasingly mobile population who have gone from periodically ‘logging on’ to ‘always on’.
No company is benefiting more from this trend than Facebook. It has been successful in leveraging its platform to facilitate user interactions at scale in a myriad of different ways, at any time of the day. While the ‘always on’ user views, posts, likes and shares, Facebook is working away in the background collecting a share of the value created in the form of advertising.
Today, 93% of its total advertising revenue is generated from mobile which is still growing north of 20% a year.
Facebook – user revenue growth (US$ millions)
While Facebook is the type of business we love to own in the Fund, we had been cautious on buying it. Recall our prior discussion on the rationale for details on our view.
Our investment process favours companies with dominant market shares and a growth profile capable of sustaining a competitive advantage over peers. We then look for an opportunity to invest in these companies. This usually occurs after they have experienced a substantial drop in their share price or have had flat earnings for an extended period of time.
As such, our investment in this area thus far has been limited to Alphabet Inc. (Google’s parent entity). We haven’t seen value in most of the other names, that is until recently.
Facebook’s share price underperformed the market from mid-2018 following news that confidentiality of its user data had been compromised. It traded below levels last reached in 2016, prompting a deep dive review of the company.
Facebook – share price performance vs S&P 500

The digital difference
Facebook and Google collectively account for 75% of all global (ex-China) online advertising spend. Such is the powerful combination of digital advertising and a captive, engaged user base. For advertisers the potential return on investment offers a distinct advantage over traditional forms of advertising.
Large, well curated social platforms offer advertisers the ability to have much more bespoke, targeted ad campaigns that can be enhanced and re-channelled through the course of the campaign, thanks to clever analytics that can be extracted to inform success or otherwise of the campaign. Unlike ads on TV, radio or printed materials, the advertiser doesn’t know who is watching TV, who lives in the house, what goods they’re buying online and at what time of day.
Considered together, Facebook and Google represent a powerful market share which provides clear competitive advantages.
Monetising the monopolies
Within its stable, Facebook owns and operates Instagram which was acquired in 2012. Within six years Instagram grew to amass one billion active users. Facebook is now in the process of ramping up monetisation of this asset which has become the largest growth driver for the company. The key medium of video presents a richer platform for both creators and advertisers to become more creative with their interactions.
This is similar to the opportunity we see with our investment in Google and its under-monetised Google Maps and YouTube assets.
Platform risks abate
The key concern for us with owning Facebook in the last two years has been their ability to control and monitor the content on their platform following a series of scandals. With our conservative approach we felt we needed to wait until we had clarity on the eventual new cost base and likely regulatory impact before investing.
Two recent developments have supported a change in our view:
1. Cost growth peaking – The company has had to significantly increased its expenditure on content control in 2018 and 2019. Given the direct impact on its margins and earnings we were happy to wait for signs that cost growth has peaked. In its most recent earnings update, Facebook reduced its expectations for capital expenditure in 2019 by US$1b. This means capital expenditure requirements will no longer continue to erode margins which will provide a base for profitability.
2. Regulatory impact not as bad as feared – Analysis of the company’s first quarter results showed a US$3b expense accrual based on expectations of a fine from the FTC in the range of US$3-5b. From our perspective, we could not forecast this potential outcome with any certainty, but comparing it to similar fines levied against Alphabet in the past couple of years gave us confidence Facebook won’t be penalised at a significantly higher level.
News reports in July indicate a Facebook has reached a settlement with the FTC of US$5b for the privacy breaches, which is within the company’s earlier guidance. The market has responded positively to the news, which was reflective of our premise on this issue.
We believe that the regulatory scrutiny will continue for some time and there will be associated costs. However, we also believe company management have acknowledged the reality of the situation and are driving operational change to reduce such risks and improve profitability.
Giving Facebook a ‘like’
We have held a favourable view on Facebook’s fundamentals for some time, but its valuation, unquantifiable regulatory risks and uncertainly of its ultimate profitability had precluded an investment. With an improved valuation (cash adjusted price-earnings multiple of 16x and a buyout yield — our preferred whole-of-company valuation measure — of 8%), greater clarity on the aforementioned costs and importantly, management’s actions to ameliorate operations for the platform, we have been able to improve our conviction.
We initiated a position in Facebook for the Fund in April and will look to add to our exposure as we see further evidence of the company sustaining its operating margins and containing costs.
Does ownership of shares by a company’s senior leadership actually align interests and drive better results? And what is a true measure of alignment anyway? In our experience, effective alignment actually goes beyond having financial incentives in place.
A true sense of alignment requires a mindset that engenders belief in the long term success of a company.
The words of Texas Instruments’ CEO last month are particularly poignant in this regard and characterise his inherent mindset.
“To me, at the highest level, it’s a philosophy or a belief of a couple of things. First it is act like owners, owners that are going to own the place for decades, and then when you get inside of that you start to look at and make sure you’re focused on getting stronger, and not just bigger … and in many ways. We spend a lot of time on this internally, if you’re focused on getting stronger and you’re aimed at the right markets, the result is you will get bigger”
Rich Templeton
CEO, Texas Instruments Inc
Source: Sanford C Bernstein Strategic Decisions Conference, New York, May 27th 2019
Although a company is never immune to the economic cycle, the Texas Instruments leadership team exhibit complete ownership of the business strategy to ensure it is able to ride through the difficult times.
Texas Instruments is the world’s number one analogue semiconductor company which forms the nucleus of our many and varied connected devices. Its leadership offers a prime example of the owner-operator mindset we look for in company management.
One of the key tenets of our very different approach to investing is to apply this lens on a company’s management. Through time we have found a high degree of success in backing company management teams that exhibit an owner-operator mentality. This goes beyond any financial incentives in place as it is an indicator of a longer term sustainable growth mindset.
Texas Instruments is positioned for continued growth, with a highly diversified product mix skewed to the secular growth industries of automotive and industrial, where they operate across six and 13 sub-sectors, respectively.
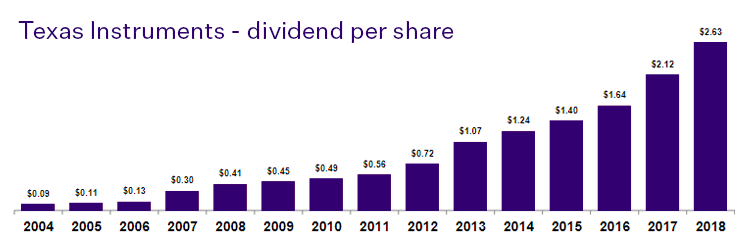
For the past 15 years we have witnessed success in this management philosophy. Through this time they have delivered, on average, double-digit growth in free cash flow and a dividend which has increased each consecutive year.
This kind of stewardship is at the core of its success.

The 2017/18 financial year saw a return to more normalised conditions in global share markets. By ‘normal’ in this sense we refer to the levels of volatility and dispersion in stocks, sectors and countries that are historically more typical of markets. The post-GFC phase of ultra-low interest rates across the major economies came to a close and so began the process of structural adjustment from the ‘lower for longer’ disposition that has supported valuations for risk assets and kept sovereign bonds in the unloved basket.  The task ahead for investors was to position portfolios for the inevitable unwinding of policy support and accurately predict the trajectory of interest rates and inflation. History has also shown that this is an imperfect science, fraught with variability.
Adding to the uncertain course for markets were disruptions to the political landscape. Investors were considerably influenced by Trump tweets, the emergence of populist power and trade war rhetoric as well as the more structural shifts relating to US tax policies, energy prices and household balance sheets. Developments in these areas frequently dominated the news headlines and generally left investors uneasy. But the underlying stories provided for a more sanguine assessment of capital markets and an important reminder for investors to buy the fundamental story of the asset and apply an active and focused approach to selecting investments.
Australian shares
The Australian share market certainly proved to be fertile ground for active decision makers. In aggregate, the market delivered a gain of 13.2% for the financial year, although there was considerable dispersion in the winners and losers at the stock and sector level. At the broadest level, Resources (+40.3%) considerably outpaced Industrials (+8.1%). The Materials sector (+29.9%) was a beneficiary of strengthening demand for bulk commodities such as iron ore. The Energy sector (+41.9%) was a standout performer, supported primarily by a 61% increase in the crude oil price. Such a rise proved fruitful for energy companies such as Santos (+106.9%) and Beach Petroleum (+217.1%) but acted as a tax on other companies, given the flow-on effects for input costs or consumer responses to discretionary spending.
“The spread of winners and losers over the past year reflects the multi-layered impacts of disruption, regulation and innovation. We’re likely to see these themes persist for some time, which is exactly the environment that will reward active, research-driven company selection.”
Crispin Murray
Head of Equities, Pendal Group
Big was not necessarily beautiful in 2017/18. Smaller companies (+24.4%) outperformed their large cap counterpart, in part reflective of the relatively high resources exposure. The prospect of tightening monetary conditions hampered the bond-sensitive sectors, which collectively rose by an uninspiring 0.7%.
Within the Industrials segment, Health Care (+27.7%) outperformed, although in common with the divergence in performance across the market, fortunes were mixed. At one extreme was Sirtex Medical (+97.9%) which benefitted from a bidding war for the company between US-based Varian Medical Systems and China-based alternatives fund manager, CDH Investments. In contrast, the laggards in this sector were Monash IVF (-35.6%) and Impedimed (-47.7%).
Also weighing on the industrials grouping were Telecommunication Services (-30.9%) and Financials ex-Property Trusts (+1.6%). Telstra was the major source of weakness for its sector, falling 34.4% on the back of its declining earnings growth and a cut to its dividend. Meanwhile, the major banks were dealt their fair share of challenges a Royal Commission, higher funding costs and regulatory imposts to name a few. ANZ Banking Group (+3.9%) was the pick of the big four banks, while Commonwealth Bank (-7.0%) was best avoided for banking exposure.
Listed property
The domestic listed property sector matched the performance of the broader share market in 2017/18. The sector benefitted from some supportive macro factors, primarily the pushing out of expectations for interest rate rises and a benign inflationary environment. In contrast to the dispersion theme across industry sectors, the property sectors exhibited considerably less deviation in performance. In aggregate, 33 out of the 34 A-REITs generated a positive return, with 23 of these being in excess of 10%. The big news influencing the sector was in retail land, with investors concerned about the impact of online competition. The exit of sector heavyweight, Westfield Group, following the takeover by European property giant Unibail Rodamco as part of a A$32b deal which completed at a substantial premium, saw around A$7b of cash proceeds out to find a new home. Across the sector, industrial property REIT, Property Link Group (34.4%) topped the table, while Stockland (-3.6%) dipped into negative territory.
“Fundamentals for the Australian property sector remain sound, but not uniform. We expect to see greater distinction between the quality and sub-par operators and across sectors over the year ahead as valuations are more closely scrutinised.”
Peter Davidson
Head of Listed Property, Pendal Group
Global shares
Global shares delivered a strong return for Australian investors, although a weaker Australian dollar limited the gain to 10% for investors that hedged the currency. US stocks continued to gather momentum against a favourable macroeconomic backdrop. Global markets suffered a temporary correction in February, triggered primarily by the latest US labour market data and fears of prospective inflation and uncertainties over Trump’s ‘policy on the run’ approach to resetting the global trade landscape. But where investors are concerned, America may already be great again – as indicated by the 14.4% total return from the S&P 500 Index in 2017/18.
US corporates also responded favourably to President Trump’s corporate and personal tax cuts. This, coupled with a resilient economy that now boasts annual GDP growth of 2.8%, solid jobs growth and unemployment at a 48-year low of just 3.75%, provide meaningful justification for double-digit returns from US shares. These data points supported decisions by the US Federal Reserve (Fed) to progress its monetary unwind, raising the Fed Funds rate on three occasions over the course of our financial year.
“Trump tantrums are actually helpful for us as investors. They distract those who follow the headlines and allow investors focused on fundamentals to hone in on the company narratives.”
Ashley Pittard
Head of Global Equities, Pendal Group
President Trump’s mantra on global trade led to ramifications for markets in Europe, the UK and Asia. The first in a series of tariff imposts against China came into effect in January, with ensuing measures levied on around US$50b worth of high tech and industrial imports from China. China’s own economy continued to grow, albeit at a declining rate of expansion as growth stabilised at a 6.8% annual rate. Shares listed on the mainland underperformed the Hong Kong bourse, while other emerging Asia markets were somewhat impacted by weakening sentiment from the trade rhetoric and higher oil prices. Japan continued to diverge in performance, delivering a return of 11.3%.
European markets had their own share of challenges, ranging from political destabilisation and the European Central Bank (ECB) continuing to pursue a gradual unwinding of monetary stimulus, through to consternation over the shape and form of Brexit. Returns from the region were an uninspiring 4.3%, even less for investors in the share markets of Spain and Germany.
Fixed income
It was a year of two halves for bond markets. Early in the period, further signs of growth taking hold in the major economies led to expectations of inflation returning in the near term, sending government bond yields higher. A change in the guard at the Fed was accompanied with the market’s notion that incoming Chair, Jerome Powell, would pursue an aggressive tightening agenda. This also coincided with the sell-off in equity markets and bonds also sold off, sending yields higher. The market has moderated fears since this time as the Fed progressed with its program of normalising interest rates. The European Central Bank (ECB) also progressed along a similar path of reducing stimulus, albeit at a more measured pace. In contrast, the Reserve Bank of Australia has retained its cash rate at 1.5% for a record length of time. A confluence of low wage growth, household indebtedness and benign inflation has kept the board from acting in concert with its global peers.
“The return of volatility was a significant shift in the market environment over the past year. As a defensive manager, our funds were well-positioned to benefit from the opportunities presented. We expect volatility to persist as markets continue to feel the effects of an ongoing liquidity drain and elevated political uncertainty.”
Vimal Gor
Head of Income & Fixed Interest, Pendal Group
The result was a very moderate return from fixed income. Global bonds returned 2.1%, while Australian bonds fared somewhat better with a 3.1% return. Credit spreads on Australian corporates tightened in the second half of 2017 alongside healthy risk appetite. This was driven by accommodative global central bank monetary policy settings, the much-anticipated US tax reform and better-than-expected reporting sessions out of the US and Europe. However, credit spreads subsequently reversed moves for the entire second half of 2017 in the first six months of 2018 as volatility increased on the back of fears over higher US inflation and geopolitical risks. Meanwhile, the Australian dollar weakened against the major counterparts over the year, down 3.7% against the US dollar, 5.9% against the euro and 5.2% against the British pound.
Investment implications
The normalisation process for monetary policies across the globe will erode progressively the valuation support that unilaterally low risk-free rates have provided to growth assets. This changing environment should also increase the level of dispersion in returns both within and across asset classes as focus returns to fundamental rather than market momentum drivers. That said, the speed and nature of this adjustment is uncertain and further complicated by more esoteric forces like global trade, political brinkmanship and structural changes in the shape and composition of industries.
Investors are likely to experience temporary bouts of volatility and greater dispersion between the performance of different asset classes, sectors, industries and companies over the next few years. Despite the uncertainties, this is very fertile ground for investors to take active, research based decisions on where and how to allocate capital. While some of the imbalances across markets may persist and warrant a degree of caution, we believe the greater risk would come from taking a set-and-forget approach to allocating capital.
Pendal continues to apply its multi-faceted approach to generating excess returns by looking through the headline factors that regularly skew market valuations and risks. Our focus is maintained on ensuring investments are actively managed to reflect the underlying stories that are driving risks and returns. Investors should also maintain an allocation to the Alternatives sector within a multi-asset portfolio. Through an appropriate selection of strategies, this sector offers diversification benefits with the potential to enhance returns.
Click here to download a copy of this article.